| Fuel Type | California In-State Generation (GWh) | Percent of California In-State Generation | Northwest Imports (GWh) | Southwest Imports (GWh) | California Energy Mix (GWh) | California Power Mix |
|---|---|---|---|---|---|---|
| Coal | 294 | 0.15% | 399 | 8,740 | 9,433 | 3.30% |
| Large Hydro | 22,096 | 11.34% | 7,418 | 985 | 30,499 | 10.68% |
| Natural Gas | 90,691 | 46.54% | 49 | 8,904 | 99,644 | 34.91% |
| Nuclear | 18,268 | 9.38% | 0 | 7,573 | 25,841 | 9.05% |
| Oil | 35 | 0.02% | 0 | 0 | 35 | 0.01% |
| Other (Petroleum Coke/Waste Heat) | 430 | 0.22% | 0 | 9 | 439 | 0.15% |
| Renewables | 63,028 | 32.35% | 14,074 | 12,400 | 89,502 | 31.36% |
| Biomass | 5,909 | 3.03% | 772 | 26 | 6,707 | 2.35% |
| Geothermal | 11,528 | 5.92% | 171 | 1,269 | 12,968 | 4.54% |
| Small Hydro | 4,248 | 2.18% | 334 | 1 | 4,583 | 1.61% |
| Solar | 27,265 | 13.99% | 174 | 5,094 | 32,533 | 11.40% |
| Wind | 14,078 | 7.23% | 12,623 | 6,010 | 32,711 | 11.46% |
| Unspecified Sources of Power | N/A | N/A | 17,576 | 12,519 | 30,095 | 10.54% |
| Total | 194,842 | 100.00% | 39,517 | 51,130 | 285,488 | 100.00% |
Source: CEC-1304 Power Plant Owners Reporting Form and SB 1305 Reporting Regulations.
In-state generation is reported generation from units one megawatt and larger.
Data as of June 24, 2019
The Year in Review
Total system electric generation is the sum of all utility-scale in-state generation plus net electricity imports. In 2018, total generation for California was 285,488 gigawatt-hours (GWh), down 2 percent, or 6,549 GWh, from 2017. California's non CO2 emitting electric generation categories (nuclear, large hydroelectric, and renewables) accounted for 53 percent of its generation, compared to 56 percent in 2017. As a result, in-state generation dropped by 6 percent (11,494 GWh) to 194,842 GWh. This decrease was due, in part, to reduced generation from hydroelectric power plants as dry conditions returned to the state. Net imports increased by 6 percent (4,944 GWh) to 90,648 GWh, partially offsetting the decline.
The overall decline observed in California's total system electric generation for 2018 is consistent with the trends observed in energy demand. In recent years, electricity demand has been flat or slightly declining as energy efficiency programs have resulted in end-use energy savings and as customers install behind-the-meter (BTM) solar photovoltaic (PV) systems that directly displaces utility-supplied generation. In 2018, BTM solar generation was estimated to be 13,582 GWh, a 20 percent increase from 2017. The strong growth in solar PV has had a measurable impact on utility served load and, consequently, on the total system electric generation summary.
California has approximately 80,000 MW of electric generation capacity installed across the state amongst more than 1,500 power plants utilizing a broad array of technologies. Total installed renewable generation capacity is 26,500 MW with almost 12,000 MW from solar and 6,000 MW from wind. Large hydroelectric power plants, considered a zero-carbon resource, provide an additional 12,000 MW of capacity while California's last remaining operational nuclear power plant, Diablo Canyon, provides 2,400 MW. Natural gas-fired power plants make up 41,000 MW or about half of the state's total generating capacity, but their energy is displaced by hydroelectric generation during wet years when spring runoff from snowpack is plentiful. The tremendous growth in utility-scale renewable generation has also helped reduce the state's reliance on natural gas, favoring those power plants that can provide fast-ramping capabilities to integrate wind and solar generation while displacing the use of aging steam generators that are slow to respond to changing grid conditions.
Data reporting requirements for total system electric generation are limited to those projects with a nameplate capacity of 1 MW and larger. As most solar PV systems installed on residential homes and commercial buildings are less than 1 MW, they are typically considered to be distributed generation and not required to report to the Energy Commission. Additional information about distributed generation can be found on the Energy Commission's Renewable Energy Tracking Progress page .
Temperatures, Precipitation, and Wildfires
California’s wide variety of climate and weather systems also play a large role in how the various generation resources shape the annual power mix. In 2018, California’s average temperature was the fourth warmest since 1895. Many cities and areas had above-average temperatures including Fresno, Los Angeles, Sacramento, San Diego, and San Francisco, with Los Angeles and San Diego having their 5th and 6th warmest year since 1946, respectively. Contributing to the national trend, the average annual temperature across the contiguous U.S. continued on its warming trend as temperatures were 1.5° Fahrenheit warmer than 2017, the 22nd consecutive year with above-average temperatures.
Total precipitation for 2018 across the contiguous U.S. was 4.6 inches above average, resulting in the wettest of the past 35 years. The national average was driven by extreme weather events on the East Coast with nine states experiencing record amounts of precipitation. California, however, differed from the East Coast as drought conditions continued in Southern California with above-average temperatures and below-normal precipitation. Northern California also began 2018 with warmer temperatures and below-normal snowpack conditions, but late-spring storms, referred to as atmospheric-rivers, aided the region’s precipitation totals.
Atmospheric rivers are long, narrow bands of moisture from the tropics that fuel enormous, rain-making storms. On average, California receives about 75 percent of its annual precipitation from November through March with these atmospheric rivers providing up to half of the state’s annual precipitation and almost 40 percent of the Sierra Nevada snowpack. However, snowpack readings measured on April 1, 2018 were still only 58 percent of average for the 2018 water year. The December-February period was the fifth driest period on record for the Sacramento watershed, a period that should normally be the wettest time of year.
California’s drought years of 2012 through 2016 created very dry vegetation conditions which were followed by an above-average wet year in 2017. This encouraged the rapid growth of grasses and underbrush that eventually became fuel for record-setting fires in the latter half of 2017; records that would be topped by even more destructive wildfires in 2018 as dryer conditions returned to the state.
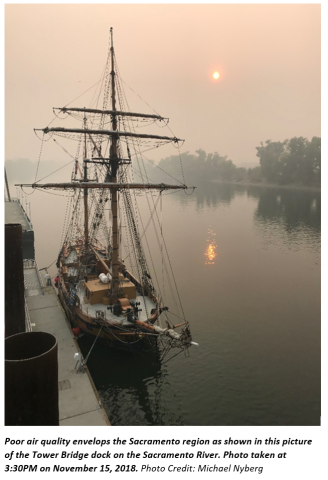
The Mendocino Complex Fire in July 2018 consumed more than 450,000 acres, dwarfing the previous record-setting Thomas Fire’s 280,000 acres just six months earlier. The Mendocino Complex Fire covered some 700 square miles and burned 280 structures in Colusa, Glenn, Lake, and Mendocino counties. Also in July, the Carr Fire in Shasta and Trinity counties covered almost 230,000 acres, largely destroying the town of Keswick and more than 1,600 structures. California’s most destructive fire came in November as the Camp Fire in Butte County extended across more than 150,000 acres. The Camp Fire would end up destroying the town of Paradise, resulting in 85 deaths and the loss of more than 18,000 structures.
The Camp Fire impacted air quality in surrounding regions as smoke spread across the Central Valley. The Sacramento Metropolitan Air Quality Management District recorded 13 consecutive unhealthy Spare-the-Air days. Air quality readings of PM 2.5 levels reached a peak of 314 for the 24-hour period of Thursday, November 15, 2018, the second highest since 2003. Readings of PM 2.5 across multiple areas of Sacramento topped 400 in the overnight hours due to low inversion layers, light winds, and cool temperatures.
Hydroelectric Generation Falls while Solar and Wind on the Rise
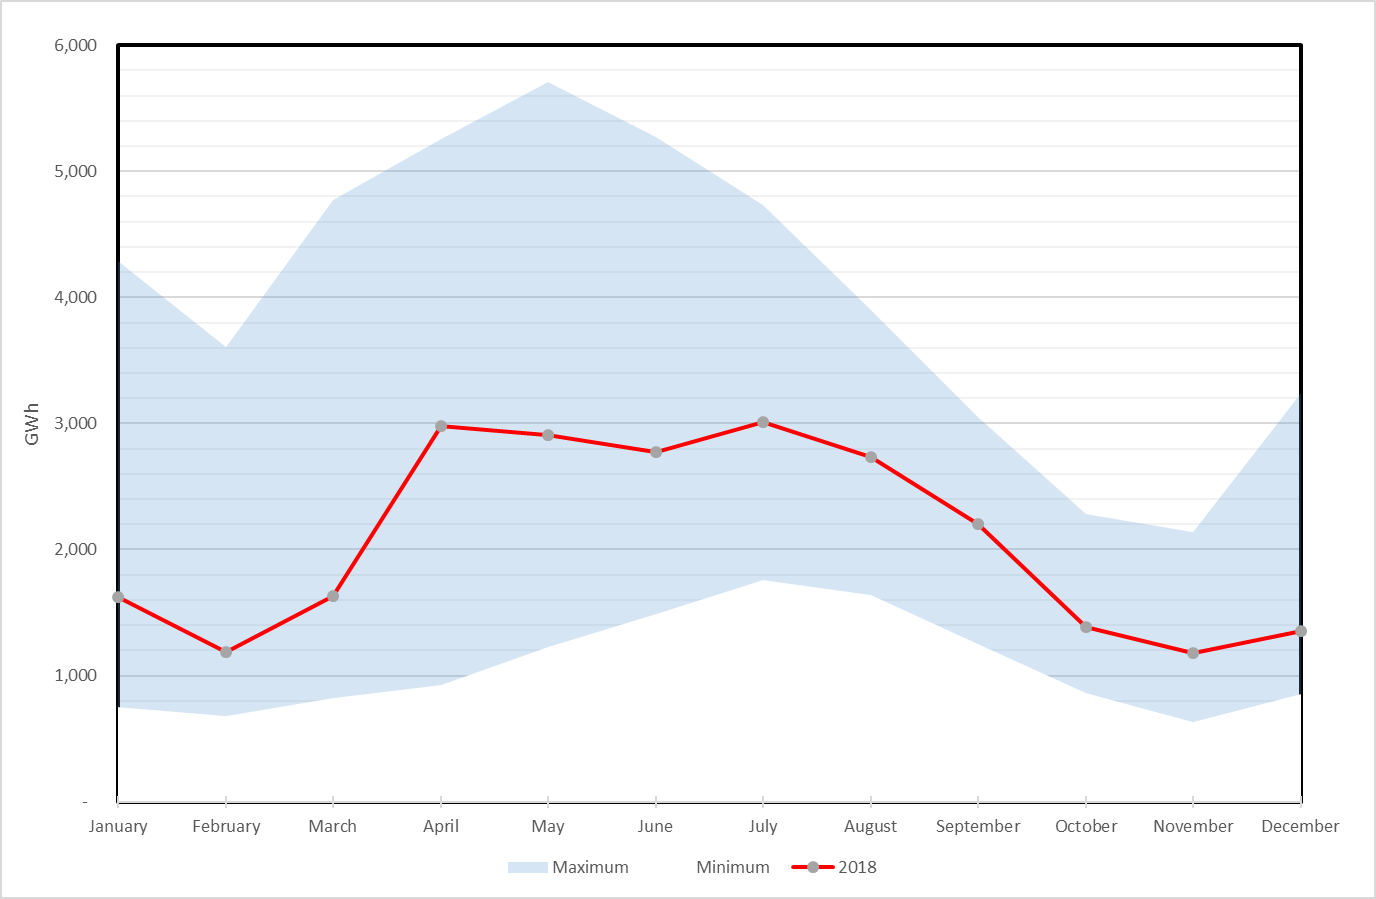
In 2018, California experienced the 34th driest year since year since 1895 as drought conditions returned to the state. The result was annual hydroelectric generation falling by 40 percent to 26,344 GWh from 2017 levels. As shown in Figure 1, monthly hydroelectric generation was well below historical levels and below average in every month except April and September when compared to monthly data since 2001.
Figure 1: Comparison of Hydroelectric Generation to Historical Highs and Lows.
California’s natural gas-fired electric generation was similar to that of 2017, accounting for almost 47 percent of in-state generation or 90,691 GWh. Imported gas-fired generation contributed an additional 8,953 GWh. As a result, natural gas totaled 99,644 GWh or about 35% of the California Power Mix.
California’s load serving entities (LSEs) reported 8,739 GWh of imported energy from out-of-state hydroelectric facilities in 2018, bringing the state’s total hydroelectric energy to 35,083 GWh¬, about 12 percent of the California Power Mix. In-state solar generation continued its fast-paced growth, growing by 12 percent (2,934 GWh) from the previous year to 27,265 GWh. In-state wind generation gained 9 percent, reaching 14,078 GWh. Imported solar and wind energy brought the category totals to 32,533 GWh and 32,711 GWh, respectively. Solar and wind generation now account for 23 percent of the California Power Mix.
While total renewable generation as shown in the California Power Mix now stands at 31 percent, this figure should not be used to track the state's progress for the Renewables Portfolio Standard (RPS) program. The reason is twofold. First, RPS is based on retail sales that do not take into account energy used for water conveyance and pumping, transmission and distribution losses, and city self-supply such as street lighting. The total system electric generation summary includes these losses and uses of energy as it is measured at the plant gate. Second, the RPS program requires verification of the eligibility of renewable energy procured by LSEs and allows for the use of Renewable Energy Credits (RECs). As LSEs are allowed to retire RECs to meet RPS procurement requirements up to 36 months from when the electricity is generated, procurement claims may include RECs that were generated in previous years. For more information on the RPS program, see the Renewables Portfolio Standard (RPS) page.
What is Unspecified Power?
Unspecified power refers to electricity that is not traceable to a specific generating facility, such as electricity traded through open market transactions. Unspecified sources of power are typically a mix of resource types, and may include renewables. This category can also include spot market purchases, wholesale energy purchases, and purchases from pools of electricity where the original source of fuel can no longer be determined. As mentioned, it can also include renewable energy from a certified renewable facility that has been sold separately from its renewable attributes, or RECs. Renewable energy without its corresponding RECs is sometimes referred to as “null energy.”
Total System Electric Generation: Methodology
The California Code of Regulations (Title 20, Division 2, Chapter 2, Section 1304 (a)(1)-(2)) requires owners of power plants that are 1 MW or larger in California or within a control area with end users inside California to file data on electric generation, fuel use, and environmental attributes. Reports are submitted to the Energy Commission on a quarterly and annual basis. These reports cover all forms of electric generation including renewables, hydroelectric, natural gas, and others. The reporting requirement includes electricity from facilities that generate for onsite usage such as refineries and university campuses. Additionally, loads from hydroelectric facilities that are equipped with reversible turbines (a combined pump and turbine generator) are taken into account. Pumping-generating facilities use electricity to meet water storage, water transfer, and water delivery requirements, while pumped storage facilities use electricity to transfer water from one reservoir to another, usually during off-peak hours at night, so that electricity can be generated during the next day to help peak electricity demand. Energy Commission staff collect and verify these reports to compile a statewide accounting of all electric generation serving California.
Quarterly data reports submitted by balancing authorities for energy imports and exports are used to determine the net energy imports for California. Imports are tracked for two geographical regions: the Northwest and the Southwest. The allocation of fuel types is based on Power Source Disclosure reports from LSEs such as investor owned utilities, publicly owned utilities, and community-choice aggregators.
Definitions
California Energy Mix: Total in-state electric generation plus Northwest and Southwest energy imports
California Power Mix: Percentage of specified fuel types derived from the California Energy Mix for use on the annual Power Content Label
In-State Generation: Energy from power plants physically located in the state of California
Northwest Imports: Energy imports from Alberta, British Columbia, Idaho, Montana, Oregon,South Dakota, Washington, and Wyoming
Southwest Imports: Energy imports from Arizona, Baja California, Colorado, Mexico, Nevada,New Mexico, Texas, and Utah
Total System Electric Generation: Used interchangeably with California Energy Mix
Total System Power: Original terminology used to describe California’s annual electric generation.
iCalifornia Energy Demand 2018-2030 Updated Forecast, Page 35, January 2018 CEC-200-2018-002-SD.
iiNOAA National Centers for Environmental Information, State of the Climate: National Climate Report for 2018, published online January, 2019, retrieved on May 29, 2019.
iiiNOAA National Centers for Environmental Information, State of the Climate: National Climate Report for Annual 2018, published online January 2019, retrieved on May 29, 2019.
ivNOAA National Centers for Environmental Information, State of the Climate: National Snow and Ice for Annual 2018, published online January 2019, retrieved on June 6, 2019.
vOffice of Environmental Health Hazard Assessment, 2018 Indicators of Climate Change in California, published February 11, 2019, retrieved on June 24, 2019.
viWater Year 2018: Hot and Dry Conditions Return, California Department of Water Resources, September 2018, retrieved on May 29, 2019.
viiTop 20 Largest California Wildfires, CalFire – The Department of Forestry and Fire Protection, retrieved on May 29, 2019 .
viiiCalifornia Department of Forestry and Fire Protection, retrieved on June 6, 2019
ixFine particulate matter (PM 2.5), made up of particles so small they can travel deeply into the respiratory tract, is an important pollutant that is a concern for people’s health when levels in the air are high.
xSacramento Metropolitan Air Quality Management District, Spare the Air website, retrieved on May 29, 2019.
xiChac, Erica et al. 2018. Renewables Portfolio Standard Verification Methodology Report, Second Edition. California Energy Commission, Renewable Energy Division. Publication Number: CEC-300-2018-008-SF, retrieved on June 24, 2019.