Columns at the project locations are scaled so the height represents the nameplate capacity or capacity factor of the project. (Capacity factor is the ratio of the energy produced to the amount that could ideally have been produced in the same period.) Circular areas at WRA locations can be switched on to show the capacities of the WRAs.
Projects are plotted on a base map that depicts wind resources across the state, and a legend shows the speed classes. The base map shows resources at 70 m height; new commercial-scale wind turbines are typically designed for at least this height. As project technology improves, greater resources become available at taller heights. Wind power is proportional to the cube of the wind speed. A doubling of wind speed at the rotor results in an eight-fold increase in wind power. County boundaries are also shown on the map for reference.
Renewable energy resources have a size and geographic distribution within each state. Planning and land use constraints limit how much of and where these resources are used, and energy generation is limited by national, state, and local policies. Two examples are the DRECP and the RETI.
By exploring the educational visualization, a viewer can gain a three dimensional understanding of the locations and distribution of wind generation projects, as well as the locations and relative capacities of the WRAs. Moving through the 3-D space gives a conception of generation capacities and capacity factors across the state. The viewer can observe that groups of projects occur at some of the high-resource regions in the state. The visualization shows that wind generation projects have been built from the southern to nearly the northern ends of California. The large range in WRA capacities is also apparent.
Values displayed are subject to revision when more accurate data is available. Data analysis and visualization is by Energy Commission staff. Base map is by AWS Truewind. For further information, see contact.
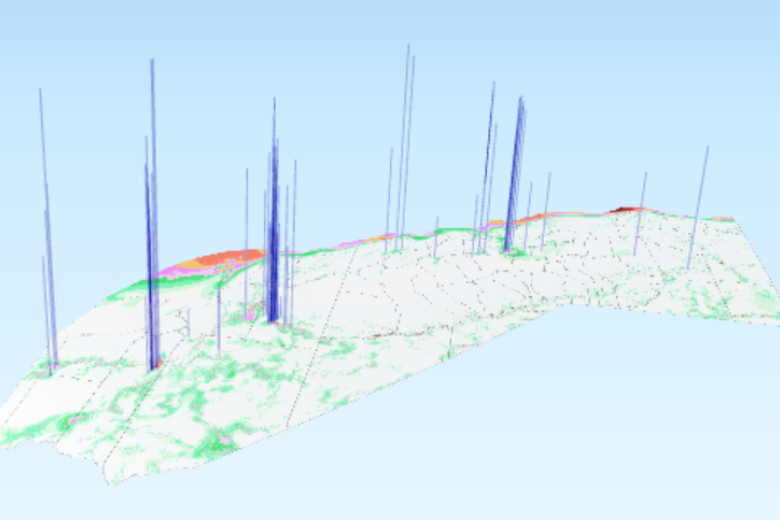
3D Interactive Visualization of California Wind Generators
The map is best viewed using the current versions of Chrome and Firefox web browsers. If using Internet Explorer, be sure Compatibility View is turned off. If you have trouble viewing the map content, contact us, and we will provide the information in an alternative format.
The 3-D map can be rotated, tilted, and panned using the buttons of the mouse and zoomed using the mouse wheel. Drop down menus allow the viewer to toggle features in the display, including project capacity, project capacity factor, and WRA capacity.
Data last updated: December 7, 2022
Data Collection Information
Data is collected through the Wind Generation Reporting System of the CEC.
Citing
Please cite use of these data and images. California Energy Commission 2022. 3-D Interactive Visualization of California Wind Generators. Data last updated December 7, 2022. Retrieved March 8, 2023 from Quarterly Fuel and Energy Reports (QFER) Data Tables.