2021 Total System Electric Generation
Contact: Michael Nyberg | QFERGEN@energy.ca.gov | Energy Assessments Division
- 2020 Total System Electric Generation and previous years
- 2009-2021 Total System Electric Generation Spreadsheet
Depending on browser width, scrolling of table may be necessary. Scroll bar is at bottom of table.
| Fuel Type | California In-State Generation (GWh) | Percent of California In-State Generation | Northwest Imports (GWh) | Southwest Imports (GWh) | Total Imports (GWh) | Percent of Imports | Total California Energy Mix (GWh) | Total California Power Mix |
|---|---|---|---|---|---|---|---|---|
| Coal | 303 | 0.2% | 181 | 7,788 | 7,969 | 9.5% | 8,272 | 3.0% |
| Natural Gas | 97,431 | 50.2% | 45 | 7,880 | 7,925 | 9.5% | 105,356 | 37.9% |
| Oil | 37 | 0.0% | - | - | - | 0.0% | 37 | 0.0% |
| Other (Waste Heat/Petroleum Coke) | 382 | 0.2% | 68 | 15 | 83 | 0.1% | 465 | 0.2% |
| Nuclear | 16,477 | 8.5% | 524 | 8,756 | 9,281 | 11.1% | 25,758 | 9.3% |
| Large Hydro | 12,036 | 6.2% | 12,042 | 1,578 | 13,620 | 16.3% | 25,656 | 9.2% |
| Unspecified | - | 0.0% | 8,156 | 10,731 | 18,887 | 22.6% | 18,887 | 6.8% |
| Total Thermal and Non-Renewables | 126,666 | 65.2% | 21,017 | 36,748 | 57,764 | 69.1% | 184,431 | 66.4% |
| Biomass | 5,381 | 2.8% | 864 | 26 | 890 | 1.1% | 6,271 | 2.3% |
| Geothermal | 11,116 | 5.7% | 192 | 1,906 | 2,098 | 2.5% | 13,214 | 4.8% |
| Small Hydro | 2,531 | 1.3% | 304 | 1 | 304 | 0.4% | 2,835 | 1.0% |
| Solar | 33,260 | 17.1% | 220 | 5,979 | 6,199 | 7.4% | 39,458 | 14.2% |
| Wind | 15,173 | 7.8% | 9,976 | 6,405 | 16,381 | 19.6% | 31,555 | 11.4% |
| Total Renewables | 67,461 | 34.8% | 11,555 | 14,317 | 25,872 | 30.9% | 93,333 | 33.6% |
| Total System Energy | 194,127 | 100.0% | 32,572 | 51,064 | 83,636 | 100.0% | 277,764 | 100.0% |
Total System Electric Generation and Methodology
Total system electric generation is the sum of all utility-scale, in-state generation, plus net electricity imports. Items of note for 2021:
- Total generation for California was 277,764 gigawatt-hours (GWh), up 2 percent, or 5,188 GWh, from 2020.
- Renewable energy generation increased 3.5 percent in 2021, up 3,125 GWh to 93,333 GWh from 90,208 GWh in 2020. However, as total system electric generation also increased in 2021, renewable energy accounted for 33.6 percent of the total system mix - a 0.51 percent increase from 2020.
- California's non-CO2 emitting electric generation categories (nuclear, large hydroelectric, and renewables) accounted for 49 percent of its in-state generation, compared to 51 percent in 2020. The change is attributable to the continued impacts from California’s ongoing drought.
- In-state hydroelectric generation was significantly reduced, some 32 percent lower than 2020 generation levels, about 6,848 GWh lower.
- Net imports increased by about 2.4 percent (1,973 GWh) in 2021 to 83,636 GWh, partially offsetting the decreased output from California’s hydroelectric power plants.
In 2021, California once again experienced above average temperatures, as did nearly all of the Western U.S. Long-term weather stations reported record warmth in Nevada, Oregon, California, and New Mexico. All western states had stations reporting in the top ten warmest years on record. California experienced the fourth hottest year since year since 1895, as drought conditions continued in the state. As a result, annual in-state hydroelectric generation fell by 32 percent from 2020 levels to 14,566 GWh. Total hydroelectric generation, including imports, fell by 23 percent to 28,490 GWh from 37,023 GWh in 2020.
Imports
Electricity imports account for approximately 30 percent of total system electric generation each year. As part of the Western Electricity Coordinating Council (WECC), California is served by balancing authorities in other western states and Canadian provinces. Imports are grouped based on state or province of origin. The Northwest is made up of Alberta, British Columbia, Idaho, Montana, Oregon, South Dakota, Washington, and Wyoming. The Southwest category includes Arizona, Baja California, Colorado, Mexico, Nevada, New Mexico, Texas, and Utah.
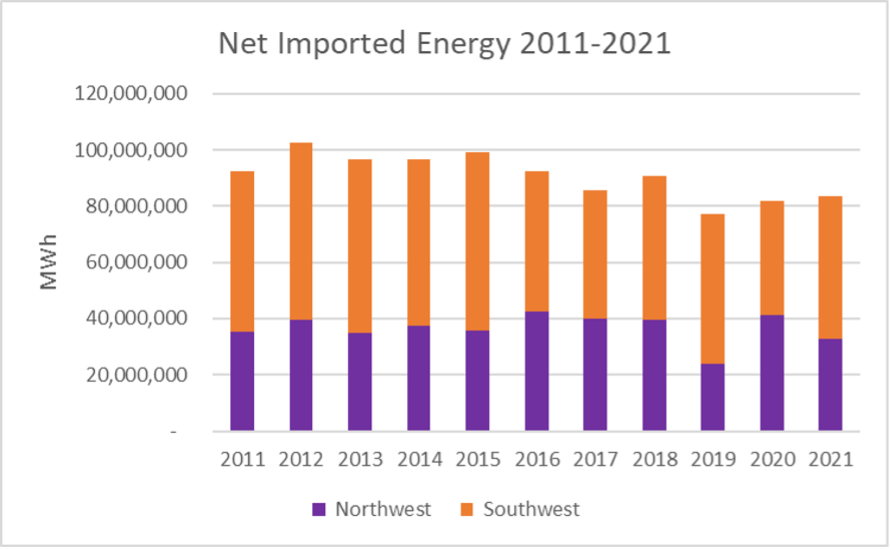
Electricity imports, as shown in Chart 1, increased by 2.5 percent due primarily to increased imports from the Southwest. While the Pacific Northwest had above-average snowpack in early 2021, warmer temperatures in April resulted in record-breaking snowmelt, reducing hydroelectric availability in the summer when California would normally import energy to meet air conditioning loads. This fast snowmelt was also exacerbated by a record-breaking heatwave in June, resulting in 2021 being tied with 1936 as the warmest summer on record in the Pacific Northwest. Ultimately, a shift of energy imports to the Southwest helped maintain overall imports into California at similar levels as those observed in 2020.
Chart 1: Net Imported Energy into California
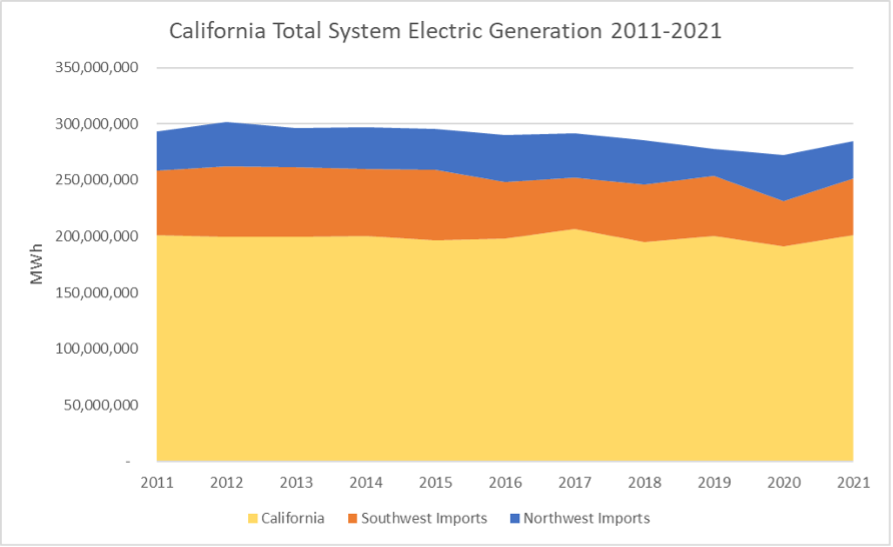
The import data by region combined with in-state generation is shown in Chart 2.
Chart 2: California Imports and In-State Generation 2011-2021
The California Code of Regulations (Title 20, Division 2, Chapter 2, Section 1304 (a)(1)-(2)) requires owners of power plants that are 1 MW or larger in California or within a control area with end users inside California to file data on electric generation, fuel use, and environmental attributes. Reports are submitted to the Energy Commission on a quarterly and annual basis. These reports cover all forms of electric generation including renewables, hydroelectric, natural gas, and others. The reporting requirement includes electricity from facilities that generate for onsite usage such as refineries and university campuses. Additionally, loads from hydroelectric facilities that are equipped with reversible turbines (a combined pump and turbine generator) are taken into account. Pumping-generating facilities use electricity to meet water storage, water transfer, and water delivery requirements, while pumped storage facilities use electricity to transfer water from one reservoir to another, usually during off-peak hours at night, so that electricity can be generated during the next day to help peak electricity demand. Energy Commission staff collect and verify these reports to compile a statewide accounting of all electric generation serving California.
Quarterly data reports submitted by balancing authorities for energy imports and exports are used to determine the net energy imports for California. Imports are tracked for two geographical regions: the Northwest and the Southwest. The allocation of fuel types is based on Power Source Disclosure reports from LSEs such as investor-owned utilities, publicly owned utilities, and community-choice aggregators.
What is Unspecified Power?
Unspecified power refers to electricity that is not traceable to a specific generating facility, such as electricity traded through open market transactions. Unspecified sources of power are typically a mix of resource types, and may include renewables. This category can also include spot market purchases, wholesale energy purchases, and purchases from pools of electricity where the original source of fuel can no longer be determined. As mentioned, it can also include renewable energy from a certified renewable facility that has been sold separately from its renewable attributes, or RECs. Renewable energy without its corresponding RECs is sometimes referred to as “null energy.”
Definitions
California Energy Mix: Total in-state electric generation plus Northwest and Southwest energy imports
California Power Mix: Percentage of specified fuel types derived from the California Energy Mix for use on the annual Power Content Label
In-State Generation: Energy from power plants physically located in the state of California
Northwest Imports: Energy imports from Alberta, British Columbia, Idaho, Montana, Oregon,South Dakota, Washington, and Wyoming
Southwest Imports: Energy imports from Arizona, Baja California, Colorado, Mexico, Nevada,New Mexico, Texas, and Utah
Total System Electric Generation: Used interchangeably with California Energy Mix
Total System Power: Original terminology used to describe California’s annual electric generation.
____________________________
[1] Note, data reporting requirements for total system electric generation are limited to those facilities with a nameplate capacity of 1 MW and larger. As most solar PV systems installed on residential homes and commercial buildings are less than 1 MW, they are typically considered to be distributed generation and not required to report to the CEC.