
2025 Total System Electric Generation
Contact: Michael Nyberg | QFERGEN@energy.ca.gov | Energy Assessments Division
- 2024 Total System Electric Generation and previous years
- 2009-2025 Total System Electric Generation Spreadsheet
Depending on browser width, scrolling of table may be necessary. Scroll bar is at bottom of table.
The Year in Review - 2025
In 2025, total system electric generation (TSEG) for California was 267,661 gigawatt-hours (GWh), down 4 percent (10,677 GWh) from 2024. TSEG is the sum of all utility-scale in-state generation plus net electricity imports from power plants with a nameplate capacity of at least one megawatt (MW). Clean energy fuel types accounted for 66 percent of California’s energy mix, a 4 percent increase from 62 percent in 2024. In-state generation was 205,698 GWh in 2025, down 5 percent from 216,181 GWh in 2024. Imported energy was virtually unchanged from the previous year at 61,964 GWh, down 0.3 percent (193 GWh) from 2024.
2025 Total System Electric Generation
| Fuel Type | California In-State Generation (GWh) | Percent of California In-State Generation | Northwest Imports (GWh) | Southwest Imports (GWh) | Total Imports (GWh) | Total California Energy Mix (GWh) | Percent of Total California Energy Mix |
|---|---|---|---|---|---|---|---|
| Coal | 244 | 0.12% | 122 | 4,324 | 4,446 | 4,691 | 1.75% |
| Natural Gas | 74,316 | 36.13% | 60 | 6,943 | 7,003 | 81,319 | 30.38% |
| Oil | 31 | 0.02% | - | - | 0 | 31 | 0.01% |
| Other (Waste Heat/Petroleum Coke) | 157 | 0.08% | - | 2 | 2 | 158 | 0.06% |
| Unspecified | - | 0.00% | 3,384 | 639 | 4,022 | 4,022 | 1.50% |
| Total Thermal and Unspecified | 74,748 | 36.34% | 3,566 | 11,908 | 15,474 | 90,221 | 33.71% |
| Nuclear | 17,575 | 8.54% | 288 | 8,536 | 8,823 | 26,399 | 9.86% |
| Large Hydro | 24,125 | 11.73% | 4,754 | 1,013 | 5,767 | 29,892 | 11.17% |
| Biomass | 4,226 | 2.05% | 653 | 52 | 705 | 4,930 | 1.84% |
| Geothermal | 10,908 | 5.30% | 167 | 2,085 | 2,252 | 13,160 | 4.92% |
| Small Hydro | 3,417 | 1.66% | 29 | 1 | 30 | 3,447 | 1.29% |
| Solar | 55,528 | 26.99% | 1,079 | 9,852 | 10,931 | 66,459 | 24.83% |
| Wind | 15,171 | 7.38% | 9,421 | 8,560 | 17,981 | 33,152 | 12.39% |
| Total Non-GHG and Renewable Resources | 130,950 | 63.66% | 16,391 | 30,099 | 46,490 | 177,440 | 66.29% |
| Total Energy | 205,698 | 100.00% | 19,957 | 42,007 | 61,964 | 267,661 | 100.00% |
Natural Gas Generation
Natural gas generation serving California dropped 14 percent from 2024 levels. The decline is due to lower summer temperatures reducing air conditioning loads, and significant growth in solar PV generation bolstered by ongoing battery storage growth. The CAISO balancing area experienced below normal temperatures for June through August 2025. CAISO’s highs were 1.5°F below normal and their lows were 1.0°F higher than normal. Similarly, CAISO’s demand peaked at 44,434 MW on August 21, 2025, significantly lower than the 48,353 MW peak recorded on September 5, 2024. Air conditioning loads within the PG&E service territory were also lower in 2025 as they experienced lower temperatures throughout the summer season. Finally, an increase of 7,000 GWh from solar PV generation in 2025 also offset natural gas generation.
Pacific Northwest Imports Below Historical Levels
Hydroelectric generation in the Pacific Northwest (PNW) improved slightly in 2025 but remained below average as lingering drought conditions and snow deficits continued. Cumulative hydroelectric generation in Washington and Oregon grew a modest 7.6 percent to 94,319 GWh in 2025. The 10-year average hydroelectric generation for the two states is approximately 105,000 GWh. As a result, California’s imports from the PNW were limited for the third year in a row. Additionally, BC Hydro continued their recent trend of importing power from the PNW to meet their own growing demand, about 5,500 GWh in 2025. Historically, British Columbia has been a net exporter of energy and a significant supplier of clean energy to California.
California’s Hydroelectric Generation and Snowpack Levels
California’s annual hydroelectric generation total in 2025 was slightly below average at 27,542 GWh, down 6 percent from 2024. Overall, 2025 output ranked 14th when compared to the past 26 years of reported data. The chart below shows the historical minimum and maximum monthly hydroelectric generation levels with generation for 2024 and 2025 depicted. Considering imports, hydroelectric generation was down modestly, about 5 percent, to 33,389 GWh for 2025 from the 35,020 GWh recorded in 2024. Natural gas-fired generation is typically displaced (reduced) by low-cost hydroelectric generation during wet years when reservoir levels are high.
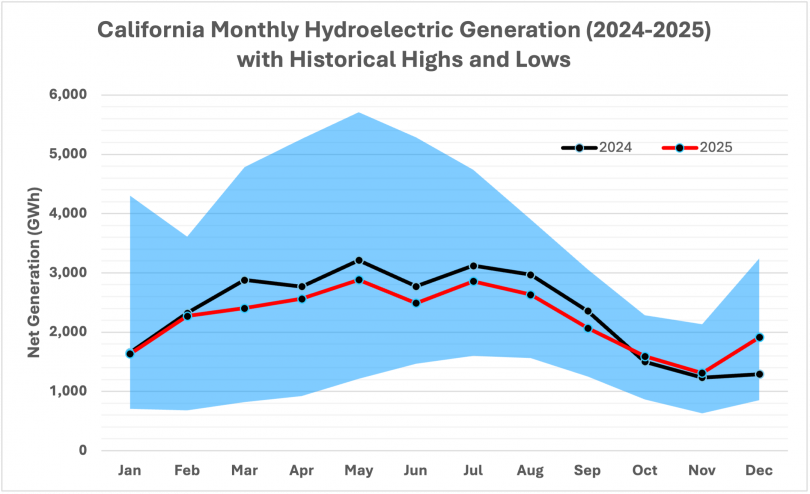
The Sierra Nevada snowpack’s snow water equivalent in December 2024 was 108 percent of normal, but an unusually dry January caused it to fall to 65 percent of average by January 31, 2025. This was offset by an atmospheric river in February 2025 that brought significant rain and snow, increasing snowpack across the northern and central Sierra Nevada. In October and November, a series of atmospheric river events impacted both Northern and Southern California. The result was that by December 30, 2025, statewide snowpack was at 71 percent of the seasonal average while major reservoirs were at 123 percent of average levels. However, by April 2026, statewide snowpack was down to 18 percent of normal. This was a result of a combination of warm storms and unusually hot weather in March 2026.
The outlook for 2026 hydroelectric generation is expected to be average or slightly above 2025 levels. First quarter 2026 reports show a slight 1 percent increase in total generation, compared to the same period in 2025. As of late August 2026, most of the major water supply reservoirs across the state are close to their historical average. In Northern California, Shasta, Oroville, and Folsom are at 81 percent, 84 percent, and 93 percent, respectively. In the Central Valley, San Luis is at 62 percent while Don Pedro and New Melones are at 93 percent and 72 percent respectively. In Southern California, Diamond Valley is at 97 percent, and Castaic is at 94 percent. California’s official water year runs from October 1 through September 31.
Annual Temperatures and Precipitation
Based on the National Oceanic and Atmospheric Administration’s annual climate report, the Western U.S. experienced above normal temperatures throughout the region in 2025 with every western state except Montana having had a top 10 warmest year on record. The year started with wildfires in southern California, including the Palisades and Eaton fires, that consumed more than 49,000 acres and over 16,000 structures. This was followed by heavy rainfall across the state in February causing widespread flooding and landslides. By May, a heatwave impacted parts of California and Nevada, setting several daily temperature records—including 99°F on May 31 at Reno-Tahoe Airport, the hottest May temperature since records began in 1888. In August, the Gifford Fire became the largest wildfire of the year for California, burning over 131,000 acres across San Luis Obispo and Santa Barbara counties, prompting widespread evacuations and destroying several structures. As mentioned above, a series of atmospheric rivers in October, November, and December brought heavy rains and flooding while delivering some much-needed snowpack in upper elevations of the state to close out the year. NOAA Notable Weather and Climate Events: Annual 2025
IEPR Demand Forecast
The 2025 Integrated Energy Policy Report (IEPR) demand forecast for statewide gross consumption is 303,046 GWh, with an estimated 30,303 GWh provided by behind-the-meter (BTM) solar PV. The resulting net-energy to serve load in 2025 is 272,743 GWh. By comparison, the TSEG for 2025 is 267,661 GWh. A difference of approximately 5,000 GWh, about 2 percent. The decrease in the TSEG for 2025 follows the same year-over-year downward trend shown in the IEPR demand forecast.
Behind-the-Meter Solar PV and Battery Energy Storage
The rapid deployment of BTM solar PV in California totaled almost 20,000 MW in 2025, displacing approximately 10 percent of energy that would otherwise be delivered by local utilities. Recent growth in battery energy storage has increased the efficiency of these solar PV systems by enabling end-users to capture energy during peak solar irradiance and then utilize the stored energy later in the afternoon when loads are typically higher. As of December 31, 2025, statewide battery energy storage capacity reached 18,296 MW across all sectors with BTM energy storage systems accounting for 3,174 MW of the total.
Data Collection
The California Code of Regulations (Title 20, Division 2, Chapter 2, Section 1304 (a)(1)-(2)) requires owners of power plants that are rated 1 MW or larger in California or within a control area with end users inside California to file data on electric generation, fuel use, and environmental attributes. Reports are submitted to the Commission on a quarterly and annual basis. These reports cover all forms of electric generation including renewables, hydroelectric, natural gas, and others. The reporting requirement includes cogeneration facilities that generate for onsite usage such as refineries and university campuses.
Additionally, net generation from hydroelectric facilities that are equipped with reversible turbines (a combined pump and turbine generator) is included in the summary. Pumping-generating facilities use electricity to meet water storage, water transfer, and water delivery requirements, while pumped storage facilities use electricity to transfer water from one reservoir to another during off-peak hours to be dispatched to meet peak demand requirements. Commission staff collect and verify these reports to compile a statewide accounting of all electric generation serving California.
Quarterly reports submitted by balancing authorities are used to determine the net energy imports for California. Imports are tracked in two geographical regions: the Northwest and the Southwest. The allocation of fuel types is based on Power Source Disclosure annual reports from load-serving entities such as investor-owned utilities, publicly owned utilities, and community-choice aggregators.
What is Unspecified Power/Unspecified Energy?
Unspecified power refers to electricity that is not traceable to a specific generating facility, such as electricity traded through open market transactions. Unspecified sources of power are typically a mix of resource types and may include renewables. This category can also include spot market purchases, wholesale energy purchases, and purchases from pools of electricity where the original fuel source can no longer be determined. It can also include energy from a CEC-certified renewable facility that has been sold separately from its renewable energy certificate, or REC. Renewable energy sold without the corresponding REC is sometimes referred to as “null energy.”
Definitions
California Energy Mix: Total in-state electric generation plus Northwest and Southwest energy imports
In-State Generation: Energy from power plants physically located in the state of California
Northwest Imports: Energy imports from Alberta, British Columbia, Idaho, Montana, Oregon, South Dakota, Washington, and Wyoming
Southwest Imports: Energy imports from Arizona, Baja California, Colorado, Mexico, Nevada, New Mexico, Texas, and Utah
Total System Electric Generation: Used interchangeably with California Energy Mix