May 2021
Solar has been successful in meeting California’s energy needs. But additional resources such as storage, demand response, and wind will be needed to meet electricity demand as the sun sets.
Renewable energy is a key part of California’s 100 percent clean energy future, making up 36 percent of the state’s retail electricity sales in 2019. But when grid operators initiated rotating outages in August 2020 during a historic heat wave, some observers questioned whether renewable resources contributed to the emergency.
The root cause analysis of the outages debunked that misconception, finding that climate change impacts and planning practices contributed to the outages, not renewables. Most notably, the report highlighted the need to better plan for the grid’s net demand peak, not just the total demand peak. Net demand is the total electricity demand minus utility-scale solar and wind generation at a given time, and the net demand peak (the “net peak” for short) typically occurs later in the evening than the total demand peak. Understanding solar and wind’s contributions and limitations to managing the net peak is key in the path to an electric grid free from greenhouse gas emissions.
Data from the past decade show that utility-scale renewable energy sources, such as solar photovoltaic power plants and wind turbines, have reduced the net peak, even as the total demand peak has remained largely flat. These trends reduced the amount of fossil fuel-fired generation needed to serve demand, helping advance California’s climate goals and save money for consumers.
Figure 1. Annual five-minute total and net peak, three-year rolling average.
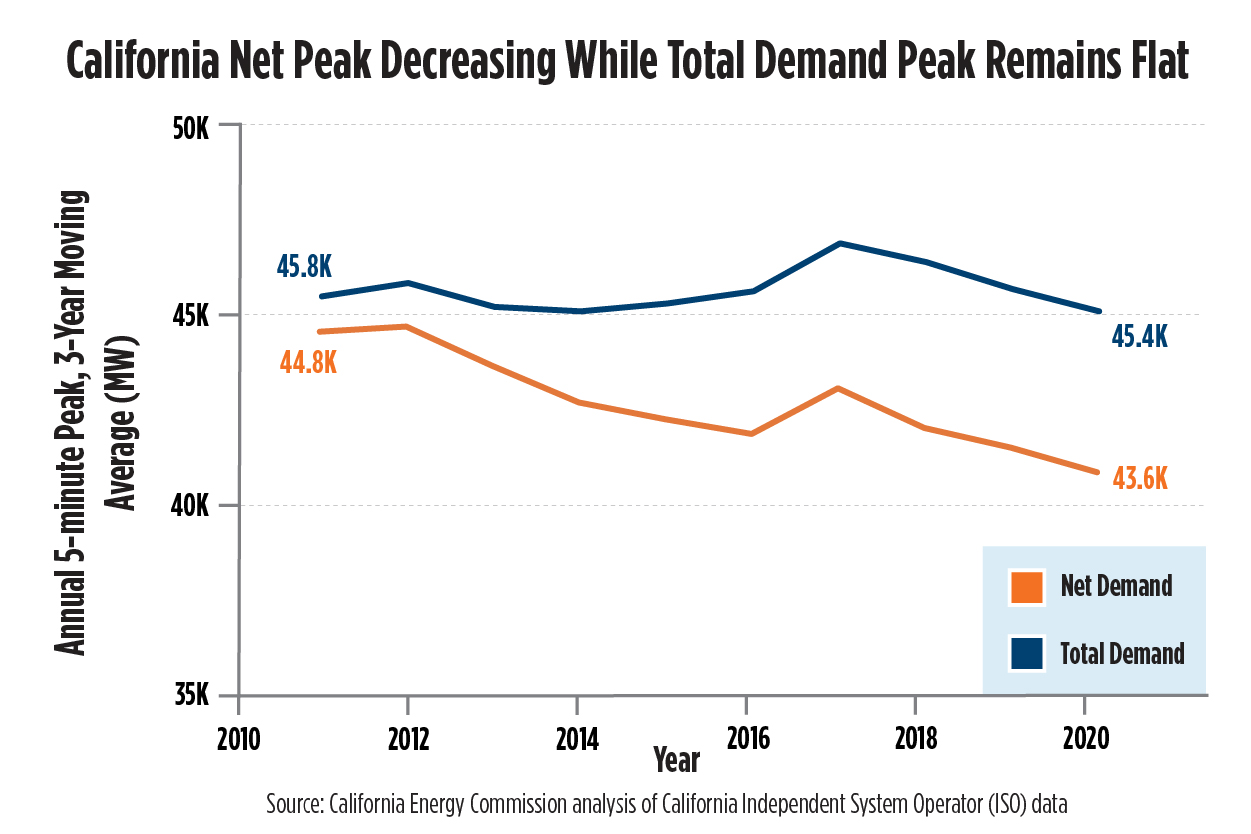
Source: CEC analysis of California Independent System Operator (ISO) data
Despite increases in renewable energy generation, reductions in the net peak have slowed in recent years. The deceleration is a result of the relative amounts of solar and wind deployed over this time. From 2015 to 2019, solar generation in California increased by 84 percent, while wind increased by just 12 percent. While solar has chipped away at daily peaks on hot summer afternoons, little wind has been brought online, leaving other resources like natural gas power plants to meet the net peak once the sun sets.
The timing of California’s total and net demand peaks illustrates why additional solar is no longer reducing the net peak. Initially, net demand peaked around the same time as total demand. Wind, which tends to pick up in the evenings, was responsible for most of the renewable generation. In 2013, solar began to eclipse wind. By 2016, the average timing of the net demand peak shifted from before 5:00 p.m. to around 7:30 p.m., where it has remained. (The total demand peak has also moved later in the evening to a lesser extent, driven by customer-owned solar.) Grid operators can’t turn to solar after the sun sets to meet the resulting net peak.
Figure 2. Average time (Pacific Daylight Time) of daily total and net peak demand, July–September 2011–2020.
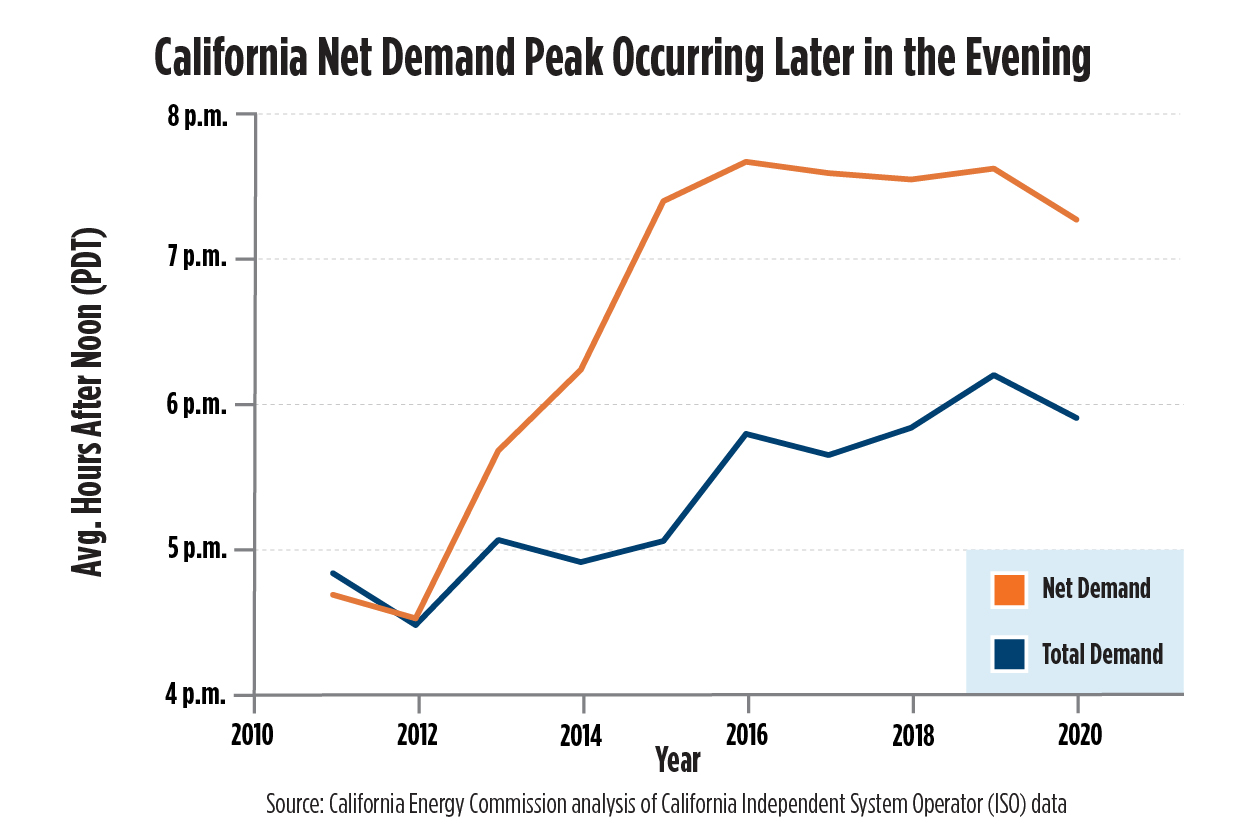
Source: CEC analysis of California ISO data
Solar plays a critical role in decarbonizing the electric grid and meeting peak demand, but more needs to be done to address the challenge grid operators face meeting the net peak. To meet the moment, California is urgently focused on diversifying its clean energy portfolio with complementary technologies, including:
- Energy storage to collect energy when solar is plentiful for later use. California is increasing storage capacity tenfold from the start of 2020 to the end of 2021.
- Demand response to unlock Californians’ potential to reduce demand when the grid is most stressed. California is modifying existing DR programs to expand participation and convening providers to maximize DR’s contribution to reliability.
- Onshore and offshore wind, which picks up when solar declines. Offshore wind captures steadier ocean winds, making its generation more predictable. A recently announced agreement with the Biden-Harris Administration opens the West Coast up for offshore wind development for the first time. Initial areas identified for projects could bring up to 4.6 gigawatts (GW) of clean energy to the grid over the next decade, enough to power 1.6 million homes. Governor Newsom’s proposed 2021-22 budget includes $20 million in funding to support the effort.
Incorporating these and other zero-carbon resources will enable California to meet its electricity needs – without increasing greenhouse gas emissions.
Key Words
Peak Demand: The highest amount of electric demand within a particular period of time. Daily electric peaks on weekdays occur in late afternoon and early evening. Annual peaks occur on hot summer days.
Net Demand: The total electricity demand in the system minus utility-scale wind and solar generation. Daily peak net demand typically occurs later in the evening than peak demand.