2022 Total System Electric Generation
Contact: Michael Nyberg | QFERGEN@energy.ca.gov | Energy Assessments Division
- 2021 Total System Electric Generation and previous years
- 2009-2022 Total System Electric Generation Spreadsheet
Depending on browser width, scrolling of table may be necessary. Scroll bar is at bottom of table.
| Fuel Type | California In-State Generation (GWh) | Percent of California In-State Generation | Northwest Imports (GWh) | Southwest Imports (GWh) | Total Imports (GWh) | Total California Energy Mix (GWh) | Total California Power Mix |
|---|---|---|---|---|---|---|---|
| Coal | 273 | 0.13% | 181 | 5,716 | 5,897 | 6,170 | 2.15% |
| Natural Gas | 96,457 | 47.46% | 44 | 7,994 | 8,038 | 104,495 | 36.38% |
| Oil | 65 | 0.03% | - | - | - | 65 | 0.02% |
| Other (Waste Heat/Petroleum Coke) | 315 | 0.15% | - | - | - | 315 | 0.11% |
| Unspecified | - | 0.0% | 12,485 | 7,943 | 20,428 | 20,428 | 7.11% |
| Total Thermal and Unspecified | 97,110 | 47.78% | 12,710 | 21,653 | 34,363 | 131,473 | 45.77% |
| Nuclear | 17,627 | 8.67% | 397 | 8,342 | 8,739 | 26,366 | 9.18% |
| Large Hydro | 14,607 | 7.19% | 10,803 | 1,118 | 11,921 | 26,528 | 9.24% |
| Biomass | 5,366 | 2.64% | 771 | 25 | 797 | 6,162 | 2.15% |
| Geothermal | 11,110 | 5.47% | 253 | 2,048 | 2,301 | 13,412 | 4.67% |
| Small Hydro | 3,005 | 1.48% | 211 | 13 | 225 | 3,230 | 1.12% |
| Solar | 40,494 | 19.92% | 231 | 8,225 | 8,456 | 48,950 | 17.04% |
| Wind | 13,938 | 6.86% | 8,804 | 8,357 | 17,161 | 31,099 | 10.83% |
| Total Non-GHG and Renewables | 106,147 | 52.22% | 21,471 | 28,129 | 49,599 | 155,747 | 54.23% |
| Total Energy | 203,257 | 100.0% | 34,180 | 49,782 | 83,962 | 287,220 | 100.0% |
Total System Electric Generation and Methodology
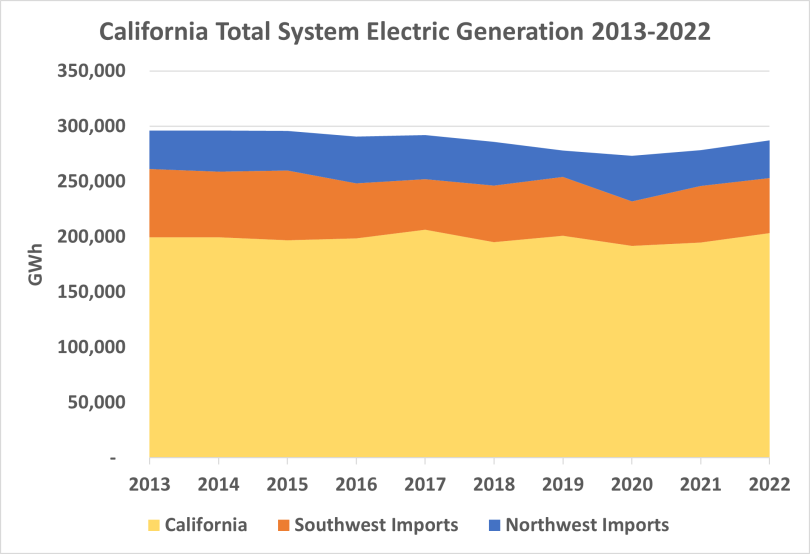
Total system electric generation is a method of accounting for the complete fuel source profile of California each year, as shown below in Chart 1. Total system electric generation is the sum of both in-state and imported utility-scale power generation. This summary does not include behind-the-meter rooftop solar photovoltaic generation [1].
Chart 1: California Imports and In-State Generation 2011-2021
Highlights for 2022
- Total utility-scale electric generation for California was 287,220 gigawatt-hours (GWh) in 2022, up 3.4 percent (9,456 GWh) from 2021.
- Utility-scale renewable generation increased 10.2 percent (9,520 GWh) in 2022 to 102,853 GWh from 93,333 GWh in 2021.
- Solar generation increased 24.1 percent (9,492 GWh) to 48,950 GWh in 2022 from 39,458 GWh in 2021.
- Renewable and non-GHG (nuclear and large hydroelectric) resources accounted for 54.2 percent of total generation, compared to 52.1 percent in 2021.
- In-state hydroelectric generation increased by 21 percent (3,045 GWh) to 17,612 GWh in 2022, accounting for 8.7 percent of in-state generation compared to 7.5 percent in 2021. Overall, all hydroelectric generation including imports accounted for 10.4 percent (29,758 GWh) of total system electric generation in 2022.
- Net imports for 2022 (83,960 GWh) were virtually unchanged from 2021 levels (83,636 GWh), accounting for 29.2 percent of total system electric generation.
Imports
As shown in Chart 2, electricity imports from the Northwest and Southwest remained at similar levels to 2021. Electricity imports account for approximately 30 percent of total system electric generation each year.
Chart 2: Imported Energy into California
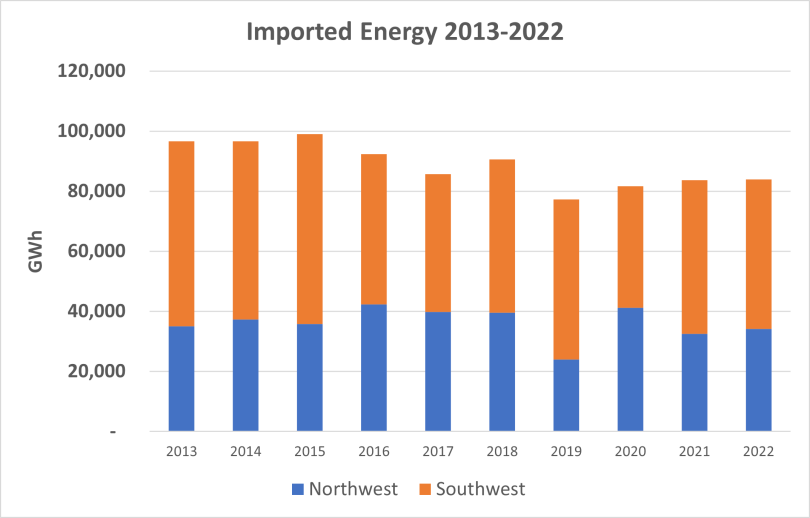
As part of the Western Electricity Coordinating Council, California is also served by balancing authorities in other western states and Canadian provinces. Imports are grouped based on state or province of origin. The Northwest category is made up of Alberta, British Columbia, Idaho, Montana, Oregon, South Dakota, Washington, and Wyoming. The Southwest category includes Arizona, Baja California, Colorado, Mexico, Nevada, New Mexico, Texas, and Utah.
Data Collection
The California Code of Regulations (Title 20, Division 2, Chapter 2, Section 1304 (a)(1)-(2)) requires owners of power plants that are rated 1 MW or larger in California or within a control area with end users inside California to file data on electric generation, fuel use, and environmental attributes. Reports are submitted to the Energy Commission on a quarterly and annual basis. These reports cover all forms of electric generation including renewables, hydroelectric, natural gas, and others. The reporting requirement includes cogeneration facilities that generate for onsite usage such as refineries and university campuses.
Additionally, loads from hydroelectric facilities that are equipped with reversible turbines (a combined pump and turbine generator) are taken into account. Pumping-generating facilities use electricity to meet water storage, water transfer, and water delivery requirements, while pumped storage facilities use electricity to transfer water from one reservoir to another, usually during off-peak hours at night, so that electricity can be generated during the next day to help peak electricity demand. Energy Commission staff collect and verify these reports to compile a statewide accounting of all electric generation serving California.
Quarterly data reports submitted by balancing authorities for energy imports and exports are used to determine the net energy imports for California. Imports are tracked from two geographical regions: the Northwest and the Southwest. The allocation of fuel types is based on Power Source Disclosure annual reports from load-serving entities such as investor-owned utilities, publicly owned utilities, and community-choice aggregators.
What is Unspecified Power/Unspecified Energy?
Unspecified power refers to electricity that is not traceable to a specific generating facility, such as electricity traded through open market transactions. Unspecified sources of power are typically a mix of resource types and may include renewables. This category can also include spot market purchases, wholesale energy purchases, and purchases from pools of electricity where the original fuel source can no longer be determined. It can also include energy from a CEC-certified renewable facility that has been sold separately from its renewable energy certificates, or RECs. Renewable energy sold without corresponding RECs is sometimes referred to as “null energy.”
Definitions
California Energy Mix: Total in-state electric generation plus Northwest and Southwest energy imports
California Power Mix: Percentage of specified fuel types derived from the California Energy Mix for use on the annual Power Content Label
In-State Generation: Energy from power plants physically located in the state of California
Northwest Imports: Energy imports from Alberta, British Columbia, Idaho, Montana, Oregon, South Dakota, Washington, and Wyoming
Southwest Imports: Energy imports from Arizona, Baja California, Colorado, Mexico, Nevada, New Mexico, Texas, and Utah
Total System Electric Generation: Used interchangeably with California Energy Mix
Total System Power: Original terminology used to describe California’s annual electric generation
____________________________
[1] Note, data reporting requirements for total system electric generation are limited to those facilities with a nameplate capacity of 1 MW and larger. As most solar PV systems installed on residential homes and commercial buildings are less than 1 MW, they are typically considered to be distributed generation (or located behind the utility meter) and are not required to report to the CEC.