2023 Total System Electric Generation
Contact: Michael Nyberg | QFERGEN@energy.ca.gov | Energy Assessments Division
- 2022 Total System Electric Generation and previous years
- 2009-2023 Total System Electric Generation Spreadsheet
Depending on browser width, scrolling of table may be necessary. Scroll bar is at bottom of table.
The Year in Review
Total system electric generation is the sum of all utility-scale in-state generation plus net electricity imports. In 2023, total generation for California was 281,140 gigawatt-hours (GWh), down 2.1 percent (6,080 GWh) from 2022. California's non-CO2 emitting electric generation categories (nuclear, large hydroelectric, and renewables) accounted for 58 percent of total generation, compared to 54 percent in 2022. California’s wide variety of climate and weather systems play a large role in how the various generation resources shape the annual power mix.
2023 Total System Electric Generation
| Fuel Type | California In-State Generation (GWh) | Percent of California In-State Generation | Northwest Imports (GWh) | Southwest Imports (GWh) | Total Imports (GWh) | Total California Energy Mix (GWh) | Total California Power Mix |
|---|---|---|---|---|---|---|---|
| Coal | 257 | 0.12% | 163 | 4,561 | 4,724 | 4,981 | 1.77% |
| Natural Gas | 94,192 | 43.68% | 52 | 8,530 | 8,582 | 102,774 | 36.56% |
| Oil | 36 | 0.02% | 0 | 0 | 0 | 36 | 0.01% |
| Other (Waste Heat/Petroleum Coke) | 206 | 0.10% | 0 | 0 | 0 | 206 | 0.07% |
| Unspecified | 0 | 0.00% | 100 | 10,273 | 10,373 | 10,373 | 3.69% |
| Total Thermal and Unspecified | 94,690 | 43.91% | 316 | 23,363 | 23,679 | 118,370 | 42.10% |
| Nuclear | 17,714 | 8.22% | 196 | 8,361 | 8,558 | 26,272 | 9.34% |
| Large Hydro | 27,066 | 12.55% | 4,712 | 1,109 | 5,821 | 32,886 | 11.70% |
| Biomass | 5,037 | 2.34% | 753 | - | 753 | 5,790 | 2.06% |
| Geothermal | 10,999 | 5.10% | 221 | 2,347 | 2,569 | 13,567 | 4.83% |
| Small Hydro | 4,853 | 2.25% | 133 | 2 | 135 | 4,988 | 1.77% |
| Solar | 41,344 | 19.17% | 417 | 6,108 | 6,525 | 47,869 | 17.03% |
| Wind | 13,920 | 6.46% | 9,177 | 8,302 | 17,479 | 31,399 | 11.17% |
| Total Non-GHG and Renewable Resources | 120,932 | 56.09% | 15,609 | 26,229 | 41,838 | 162,771 | 57.90% |
| Total Energy | 215,623 | 100.00% | 15,925 | 49,593 | 65,518 | 281,140 | 100.00% |
Overview
California has approximately 87,750 MW of electric generation capacity installed across the state amongst more than 1,600 power plants that utilize a broad array of technologies. Natural gas-fired power plants make up the largest share of capacity at 39,689 MW (45 percent) of the state total. Total renewable generation capacity is 32,925 MW (37.5 percent) with 20,871 MW (24 percent) from solar and 6,284 MW (7 percent) from wind. Large hydroelectric power plants, considered zero-carbon resources, provide an additional 12,281 MW (14 percent) of capacity while California's last remaining operational nuclear power plant, Diablo Canyon, provides 2,400 MW (2.7 percent) of capacity.
Data reporting requirements for total system electric generation are limited to those projects with a nameplate capacity of 1 MW and larger. As most solar PV systems installed on residential homes and commercial buildings are rated less than 1 MW in capacity, they are typically considered to be distributed generation (also called behind-the-meter generation) and are not required to report to the Energy Commission.
Temperatures, Precipitation, and Snowpack
The large-scale weather patterns across the western United States in 2023 were partially driven by a transition from three straight years of La Niña, ending in summer, to a moderate strength El Niño that developed by late autumn. In California, cold and wet conditions with a deep snowpack (record breaking for some) was the highlight for the first half of the year and ended a three-year drought with replenished reservoirs.
While most of the contiguous U.S. experienced above-average temperatures during 2023, California experienced near- to below-average temperatures. Overall, most of California had one the coldest years in the past decade with temperatures generally 1-2 degrees Fahrenheit below normal. California also experienced above average precipitation punctuated by a series of atmospheric rivers. Atmospheric rivers are long, narrow bands of moisture from the tropics that fuel enormous, rain-making storms. On average, California receives about 75 percent of its annual precipitation from November through March with these events.
Several atmospheric river events, from late 2022 into mid-January 2023, brought record amounts of rain and mountain snow to California. Atmospheric rivers also occurred at the end of the calendar year, bringing heavy rainfall to portions of the state. Los Angeles had its sixth wettest year in the past 124 years with 29.44 inches of precipitation (207 percent of normal) and Bishop, on the east side of the Sierra Nevada, had its second wettest year with 14.55 inches of precipitation (301 percent of normal). The city of Oxnard recorded 3.18 inches of rain in less than an hour during an atmospheric river in late December.
Snowpack levels on April 1, 2023, were at record high levels throughout the Sierra Nevada. Snow water equivalent (SWE) was 200-300 percent of normal. The snow water equivalent measures the amount of water contained in the snowpack. Some snow course in the Sierra Nevada broke April 1 SWE records going back 90-100 years; snow courses are about 1,000 feet (300 meters) long and are situated in small meadows protected from the wind. Mammoth Pass, in the central Sierra Nevada, had 104.5 inches of SWE marking it the highest April 1 value in 93 years of records.
Hydroelectric Generation
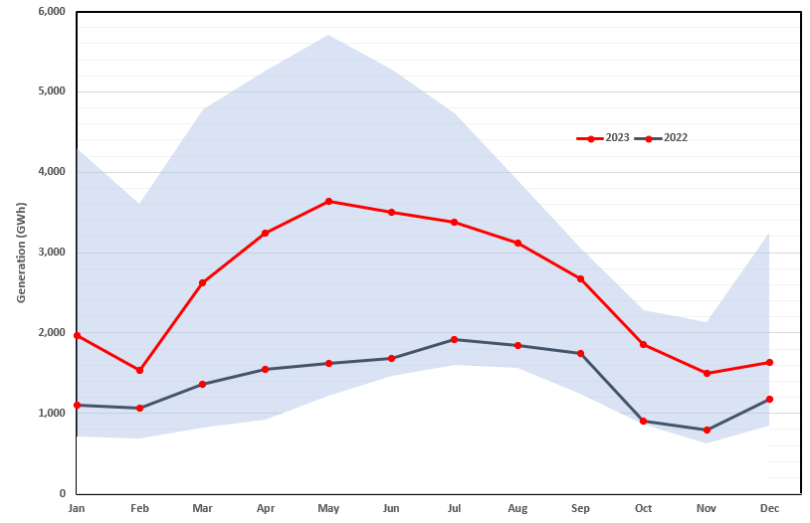
As a result of these conditions, hydroelectric generation in California increased 80 percent over the extremely low levels observed in 2022. This chart shows the historical minimum and maximum monthly hydroelectric generation reported for California since 2001 as well as monthly generation for calendar years 2022 and 2023.
California Hydroelectric Generation with Historical Minimum and Maximum Ranges
The decline observed in California's total system electric generation for 2023 is consistent with trends presented in the 2023 IEPR Demand Forecast as well as the climatic conditions experienced throughout the year. Significant growth in the adoption of battery energy storage systems along with sustained growth in behind-the-meter solar PV systems have contributed to reduced deliveries from utilities to end-use customers. In 2023 alone, more than 45,000 behind-the-meter battery energy storage systems were installed in California, bringing the statewide total to approximately 150,000 systems.
Data Collection
The California Code of Regulations (Title 20, Division 2, Chapter 2, Section 1304 (a)(1)-(2)) requires owners of power plants that are rated 1 MW or larger in California or within a control area with end users inside California to file data on electric generation, fuel use, and environmental attributes. Reports are submitted to the Energy Commission on a quarterly and annual basis. These reports cover all forms of electric generation including renewables, hydroelectric, natural gas, and others. The reporting requirement includes cogeneration facilities that generate for onsite usage such as refineries and university campuses.
Additionally, net generation from hydroelectric facilities that are equipped with reversible turbines (a combined pump and turbine generator) are included in the summary. Pumping-generating facilities use electricity to meet water storage, water transfer, and water delivery requirements, while pumped storage facilities use electricity to transfer water from one reservoir to another, usually during off-peak hours at night, to generate power at later times to meet peak demand requirements. Energy Commission staff collect and verify these reports to compile a statewide accounting of all electric generation serving California.
Quarterly reports submitted by balancing authorities are used to determine the net energy imports for California. Imports are tracked from two geographical regions: the Northwest and the Southwest. The allocation of fuel types is based on Power Source Disclosure annual reports from load-serving entities such as investor-owned utilities, publicly owned utilities, and community-choice aggregators.
What is Unspecified Power/Unspecified Energy?
Unspecified power refers to electricity that is not traceable to a specific generating facility, such as electricity traded through open market transactions. Unspecified sources of power are typically a mix of resource types and may include renewables. This category can also include spot market purchases, wholesale energy purchases, and purchases from pools of electricity where the original fuel source can no longer be determined. It can also include energy from a CEC-certified renewable facility that has been sold separately from its renewable energy certificates, or RECs. Renewable energy sold without corresponding RECs is sometimes referred to as “null energy.”
Definitions
California Energy Mix: Total in-state electric generation plus Northwest and Southwest energy imports
California Power Mix: Percentage of specified fuel types derived from the California Energy Mix for use on the annual Power Content Label
In-State Generation: Energy from power plants physically located in the state of California
Northwest Imports: Energy imports from Alberta, British Columbia, Idaho, Montana, Oregon, South Dakota, Washington, and Wyoming
Southwest Imports: Energy imports from Arizona, Baja California, Colorado, Mexico, Nevada, New Mexico, Texas, and Utah
Total System Electric Generation: Used interchangeably with California Energy Mix
Total System Power: Original terminology used to describe California’s annual electric generation