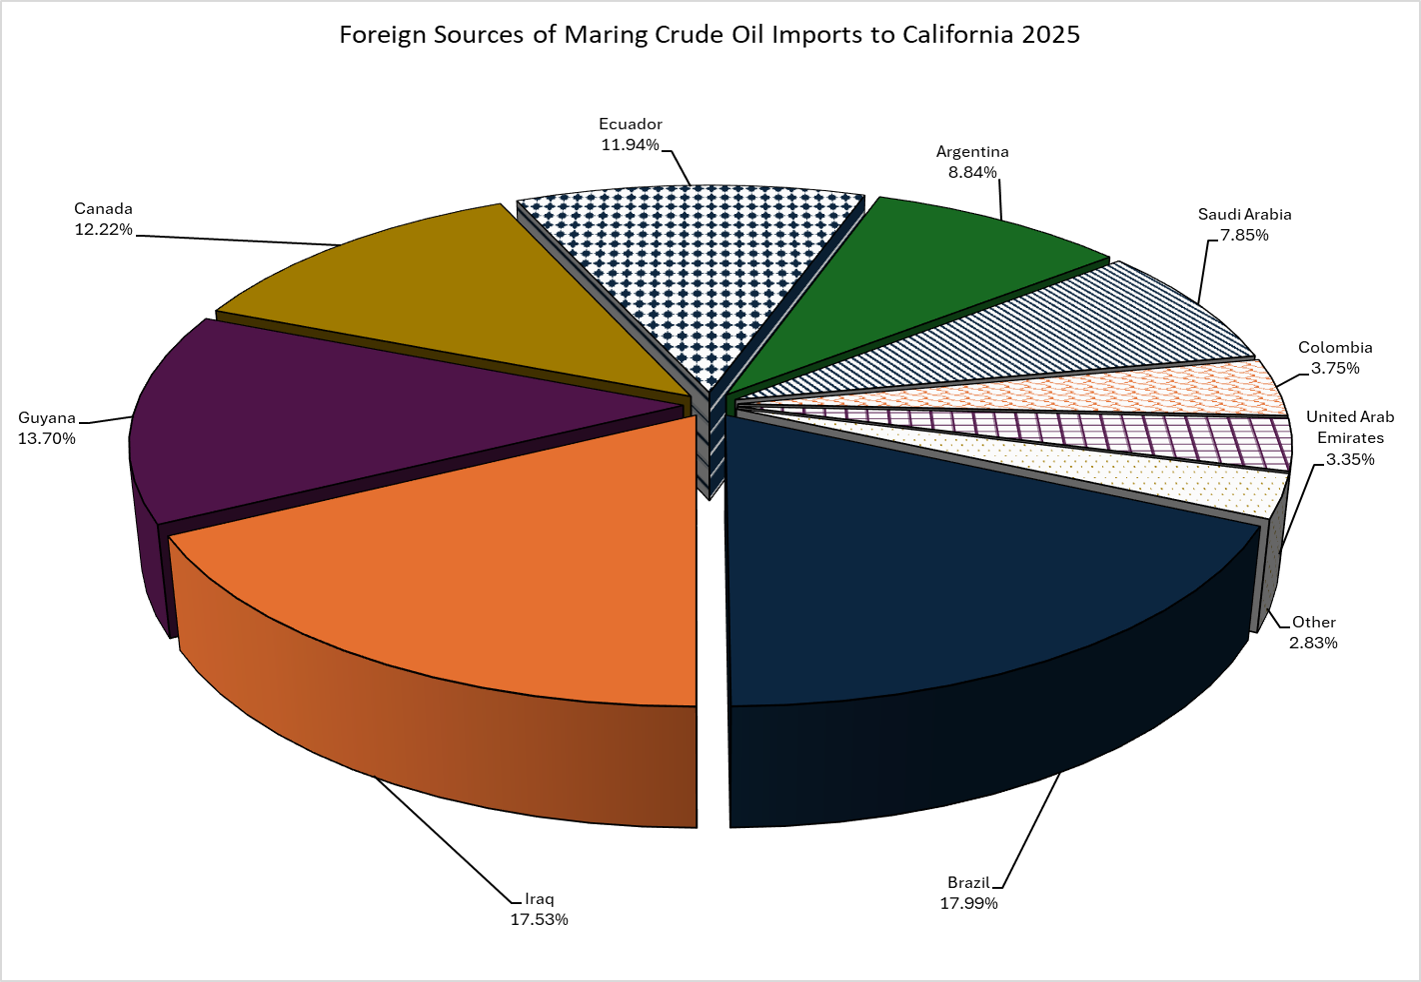
Foreign Sources of Crude Oil Imports to California 2025
| Country | Thousands of Barrels | Percentage |
|---|---|---|
| BRAZIL | 52,115 | 17.99% |
| IRAQ | 50,783 | 17.53% |
| GUYANA | 39,686 | 13.70% |
| CANADA | 35,402 | 12.22% |
| ECUADOR | 34,588 | 11.94% |
| ARGENTINA | 25,626 | 8.84% |
| SAUDI ARABIA | 22,753 | 7.85% |
| COLOMBIA | 10,880 | 3.75% |
| UNITED ARAB EMIRATES | 9,716 | 3.35% |
| Other | 8,199 | 2.83% |
| Total | 289,748 | 100.00% |
| Country | Thousands of Barrels | Percentage |
|---|---|---|
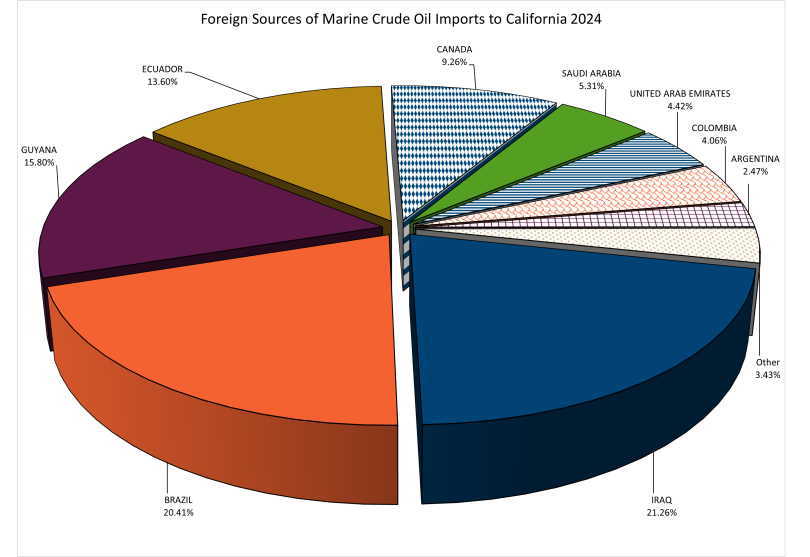
| IRAQ | 68,406 | 21.26% |
| BRAZIL | 65,675 | 20.41% |
| GUYANA | 50,840 | 15.80% |
| ECUADOR | 43,766 | 13.60% |
| CANADA | 29,796 | 9.26% |
| SAUDI ARABIA | 17,081 | 5.31% |
| UNITED ARAB EMIRATES | 14,226 | 4.42% |
| COLOMBIA | 13,076 | 4.06% |
| ARGENTINA | 7,934 | 2.47% |
| Other | 11,031 | 3.43% |
| Total | 321,831 | 100.00% |
| Country | Thousands of Barrels | Percentage |
|---|---|---|
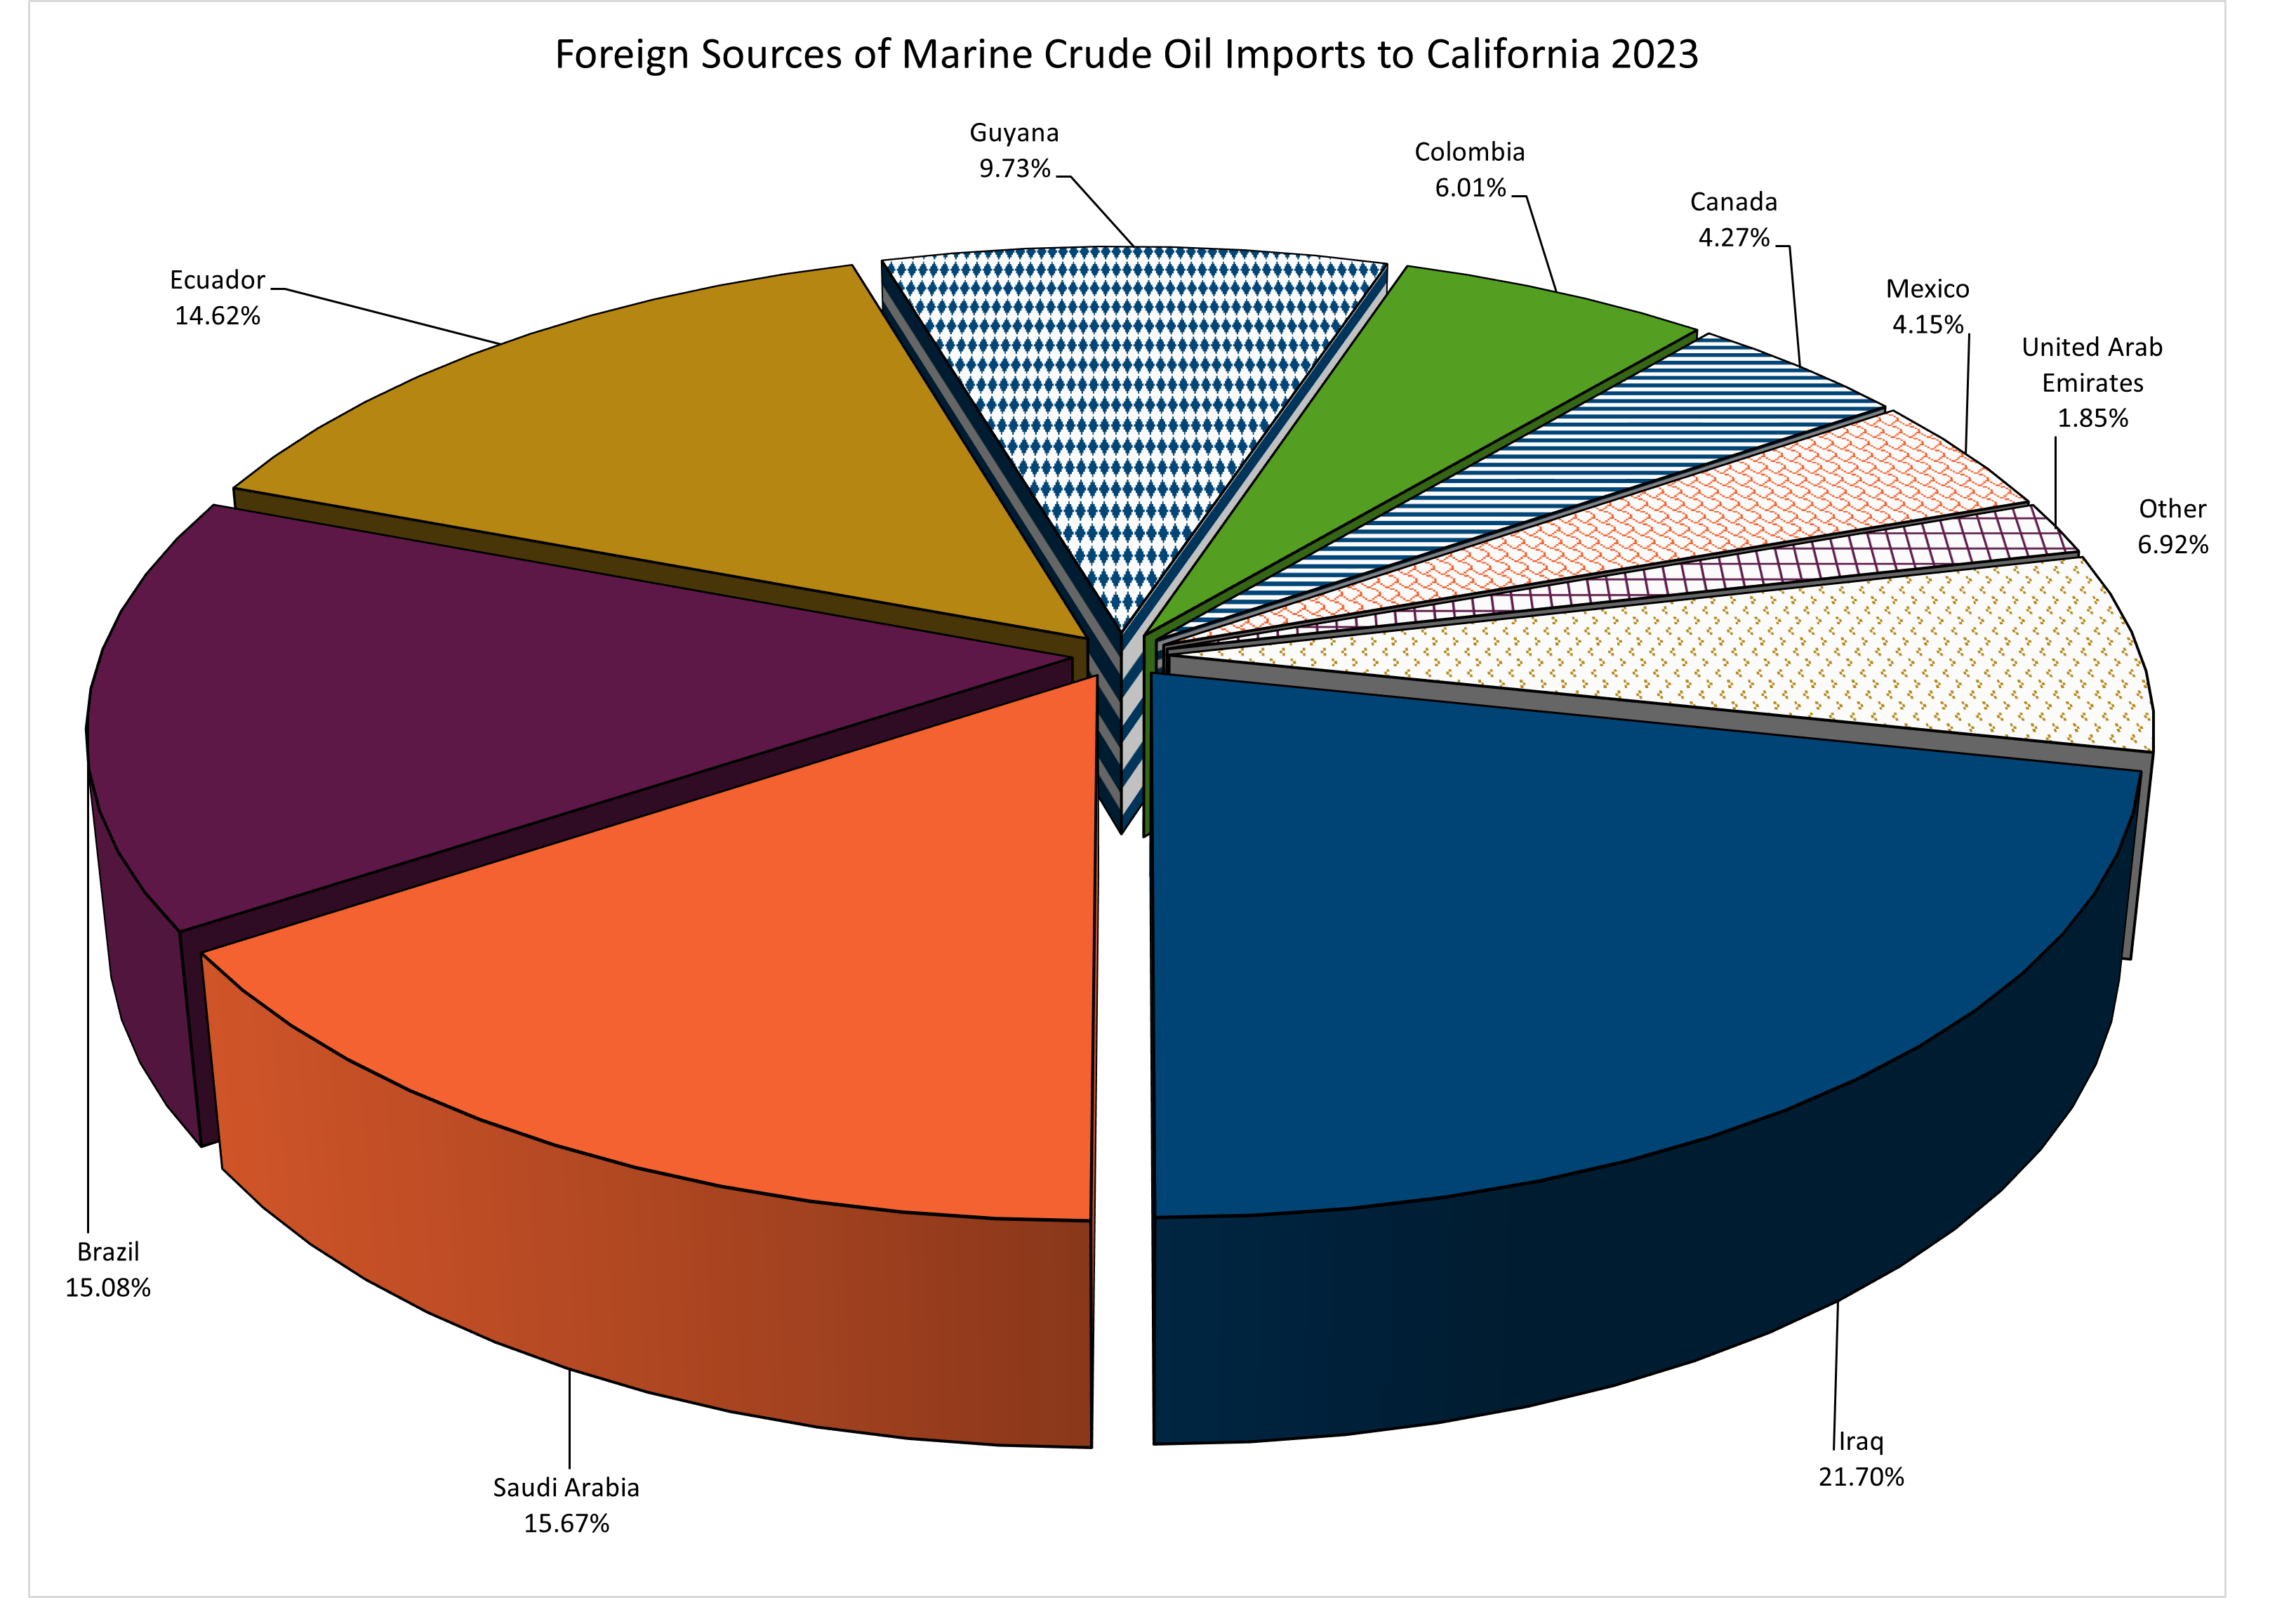
| IRAQ | 69,589 | 21.70% |
| SAUDI ARABIA | 50,253 | 15.67% |
| BRAZIL | 48,367 | 15.08% |
| ECUADOR | 46,882 | 14.62% |
| GUYANA | 31,201 | 9.73% |
| COLOMBIA | 19,276 | 6.01% |
| CANADA | 13,709 | 4.27% |
| MEXICO | 13,315 | 4.15% |
| UNITED ARAB EMITRATES | 5,944 | 1.85% |
| Other | 22,206 | 6.92% |
| Total | 320,742 | 100.0% |
Updated March 2024.
| Country | Thousands of Barrels | Percentage |
|---|---|---|
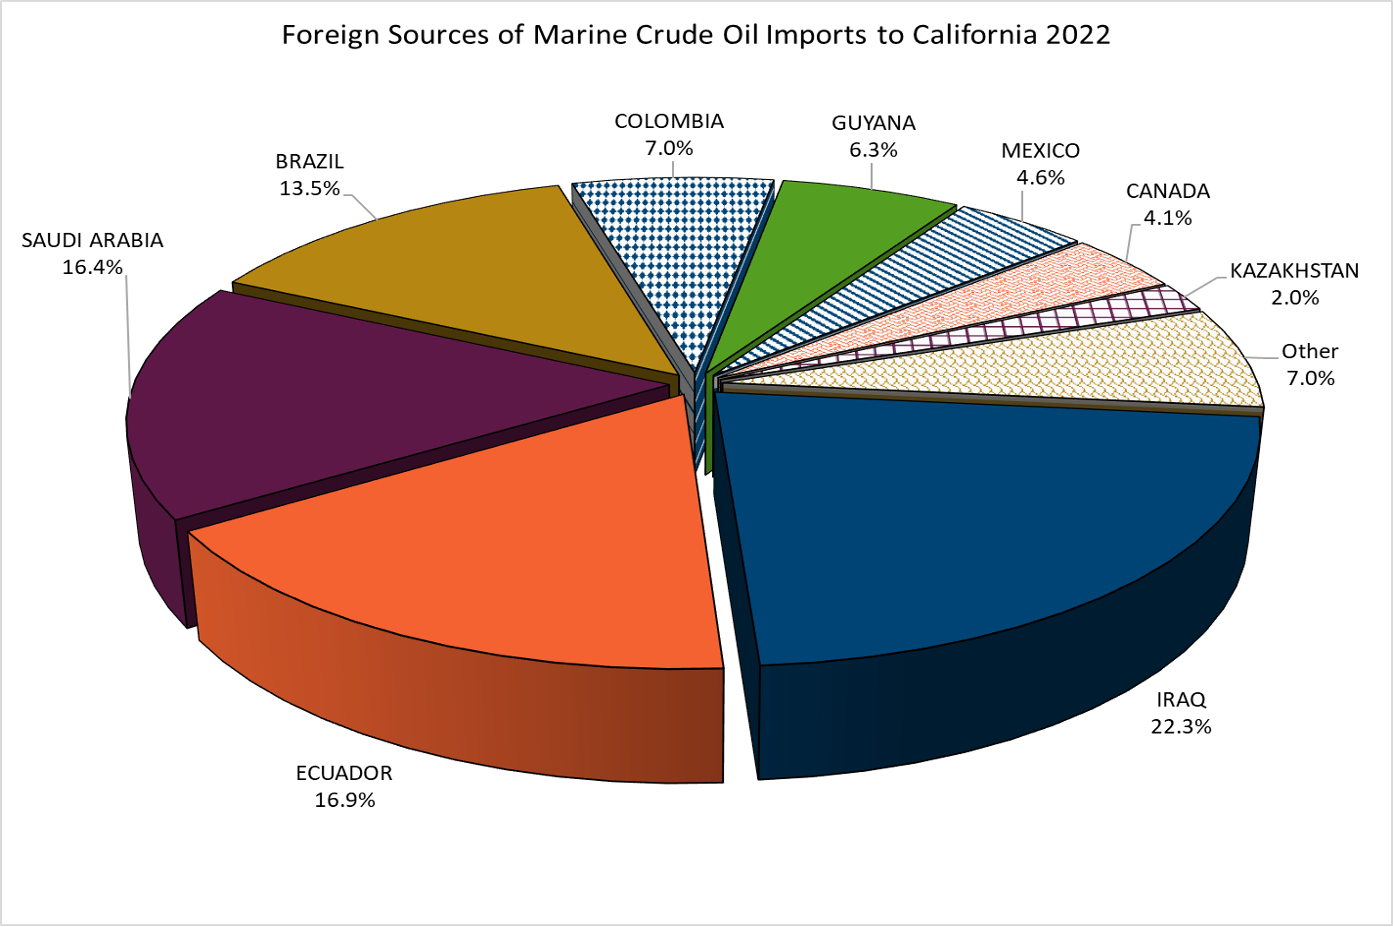
| IRAQ | 68,401 | 22.3% |
| ECUADOR | 51,974 | 16.9% |
| SAUDI ARABIA | 50,242 | 16.4% |
| BRAZIL | 41,358 | 13.5% |
| COLOMBIA | 21,512 | 7.0% |
| GUYANA | 19,202 | 6.3% |
| MEXICO | 14,257 | 4.6% |
| CANADA | 12,538 | 4.1% |
| KAZAKHSTAN | 6,082 | 2.0% |
| Other | 21,370 | 7.0% |
| Grand Total | 306,936 | 100.0% |
Updated April 2022.
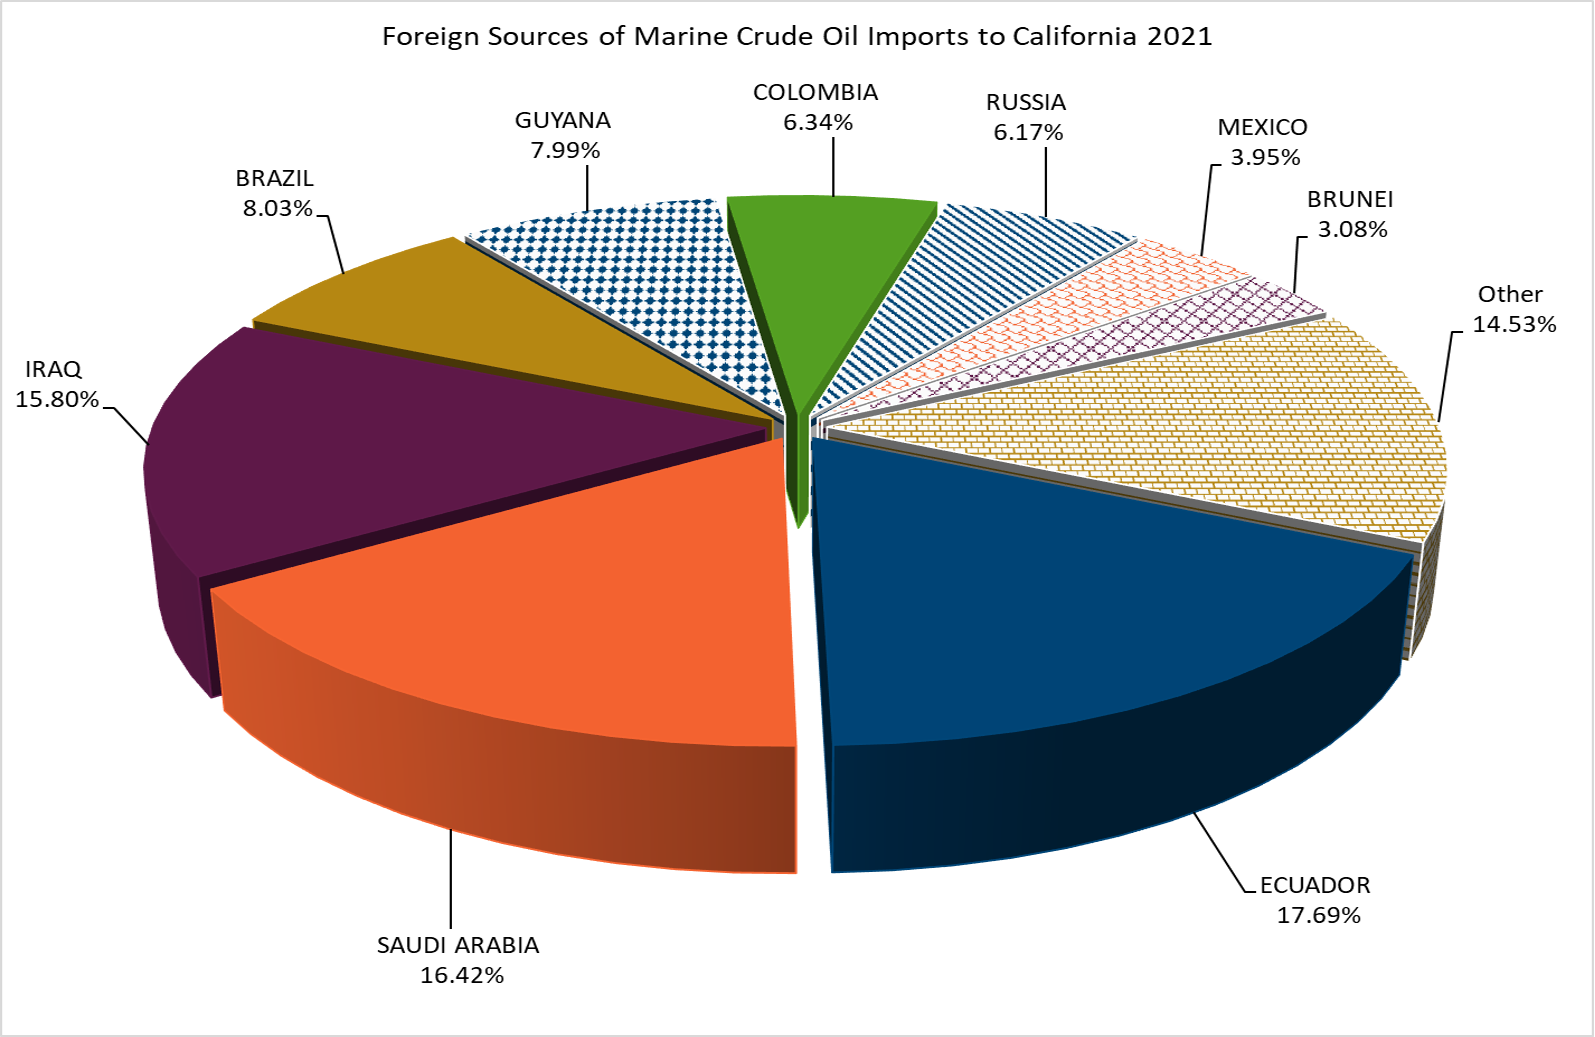
| Country | Thousands of Barrels | Percentage of Total Forgein Imports |
|---|---|---|
| ECUADOR | 52,563 | 17.69% |
| SAUDI ARABIA | 48,781 | 16.42% |
| IRAQ | 46,963 | 15.80% |
| BRAZIL | 23,852 | 8.03% |
| GUYANA | 23,741 | 7.99% |
| COLOMBIA | 18,845 | 6.34% |
| RUSSIA | 18,347 | 6.17% |
| MEXICO | 11,724 | 3.95% |
| BRUNEI | 9,160 | 3.08% |
| Other | 43,184 | 14.53% |
| Grand Total | 297,160 | 100.00% |
Updated April 6, 2021.
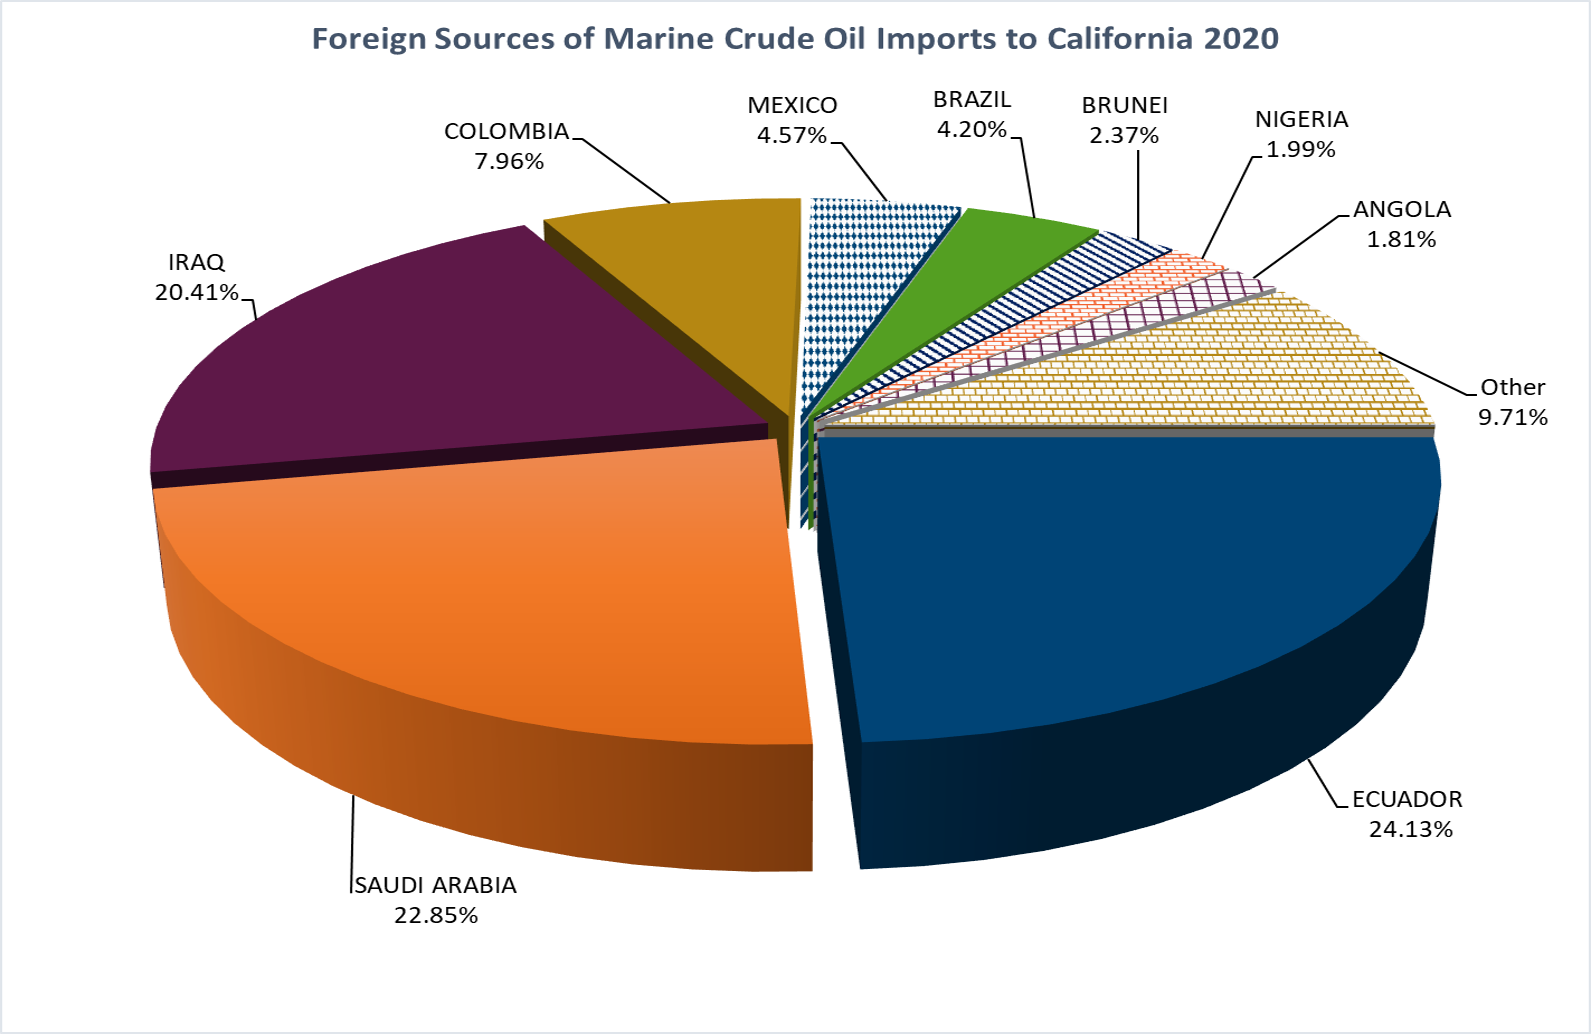
| Country | Thousands of Barrels | Percentage of Total Forgein Imports |
|---|---|---|
| Ecuador | 55,219 | 24.13% |
| Saudi Arabia | 52,287 | 22.85% |
| Iraq | 46,715 | 20.41% |
| Colombia | 18,210 | 7.96% |
| Mexico | 10,468 | 4.57% |
| Brazil | 9,621 | 4.20% |
| Brunei | 5,429 | 2.37% |
| Nigeria | 4,549 | 1.99% |
| Angola | 4,132 | 1.81% |
| Other | 22,220 | 9.71% |
| Total | 228,850 | 100.00% |
Updated July 15, 2020.
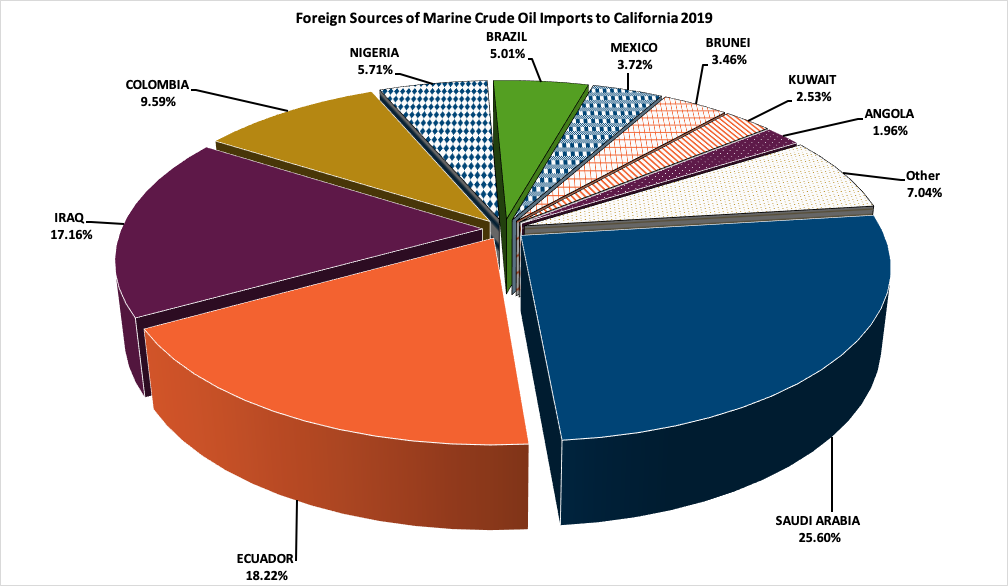
| Country | Thousands of Barrels | Percentage of Total Forgein Imports |
|---|---|---|
| Saudi Arabia | 87,601 | 25.60% |
| Ecuador | 62,370 | 18.22% |
| Iraq | 58,730 | 17.16% |
| Colombia | 32,814 | 9.59% |
| Nigeria | 19,528 | 5.71% |
| Brazil | 17,145 | 5.01% |
| Mexico | 12,736 | 3.72% |
| Brunei | 11,857 | 3.46% |
| Kuwait | 8,676 | 2.53% |
| Angola | 6,697 | 1.96% |
| Other | 24,098 | 7.04% |
| Total | 342,252 | 100.00% |
Updated March 12, 2019.
| Country | Thousands of Barrels | Percentage of Total Forgein Imports |
|---|---|---|
| Saudi Arabia | 134,818 | 37.00% |
| Ecuador | 51,799 | 14.22% |
| Colombia | 44,648 | 12.25% |
| Iraq | 29,828 | 8.19% |
| Kuwait | 22,548 | 6.19% |
| Brazil | 17,688 | 4.85% |
| Mexico | 15,064 | 4.13% |
| Canada | 10,989 | 3.02% |
| Angola | 10,691 | 2.93% |
| Other | 26,294 | 7.22% |
| Total Foreign Sources | 364,367 | 100.00% |
Source: Energy Information Administration. Please note that total of foreign oil receipts to refineries may not exactly match that shown on other pages. The Petroleum Industry Information Reporting Act (PIIRA) data gives the breakdown by foreign, California and Alaska but not the foreign countries.
| Country | Thousands of Barrels | Percentage of Total Forgein Imports |
|---|---|---|
| Saudi Arabia | 98,125 | 28.51% |
| Ecuador | 69,310 | 20.14% |
| Colombia | 48,738 | 14.16% |
| Iraq | 27,522 | 8.00% |
| Kuwait | 23,919 | 6.95% |
| Brazil | 14,860 | 4.32% |
| Mexico | 14,755 | 4.29% |
| Canada | 11,846 | 3.44% |
| Angola | 11,319 | 3.29% |
| Other | 23,828 | 6.92% |
| Total Foreign Sources | 344,222 | 100.00% |
Source: Energy Information Administration. Please note that total of foreign oil receipts to refineries may not exactly match that shown on other pages. The Petroleum Industry Information Reporting Act (PIIRA) data gives the breakdown by foreign, California and Alaska but not the foreign countries.
Archived Sources of Foreign Crude Oil - Starting from 2000 - may be available upon request.