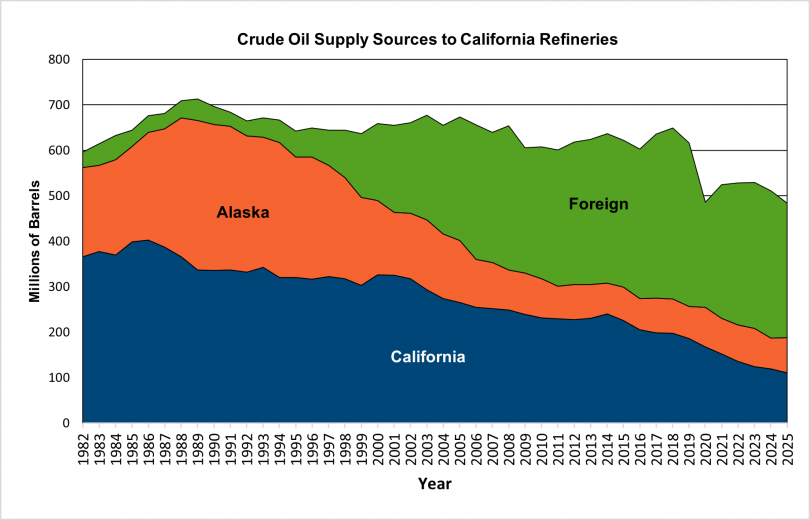
Annual Oil Supply Sources to California Refineries
(In Thousands of Barrels)
| Year | California** | % | Alaska | % | Foreign | % | Total |
|---|---|---|---|---|---|---|---|
| 2025 | 110,679 | 22.9% | 77,453 | 16.0% | 295,717 | 61.1% | 483,849 |
| 2024 | 119,057 | 23.3% | 68,263 | 13.4% | 323,329 | 63.3% | 510,649 |
| 2023 | 123,947 | 23.4% | 83,842 | 15.9% | 321,153 | 60.7% | 528,942 |
| 2022 | 136,050 | 25.8% | 80,257 | 15.2% | 311,530 | 59.0% | 527,837 |
| 2021 | 152,473 | 29.1% | 78,145 | 14.9% | 293,417 | 56.0% | 524,035 |
| 2020 | 169,211 | 34.9% | 85,662 | 17.6% | 230,581 | 47.5% | 485,454 |
| 2019 | 183,158 | 29.7% | 73,252 | 11.9% | 359,712 | 58.4% | 616,122 |
| 2018 | 199,658 | 31.1% | 72,945 | 11.4% | 369,386 | 57.5% | 641,989 |
| 2017 | 192,979 | 30.6% | 81,769 | 13.0% | 355,150 | 56.4% | 629,898 |
| 2016 | 205,528 | 34.1% | 68,765 | 11.4% | 328,513 | 54.5% | 602,806 |
| 2015 | 225,435 | 36.2% | 73,182 | 11.8% | 323,336 | 52.0% | 621,953 |
| 2014 | 240,095 | 37.7% | 67,702 | 10.6% | 328,245 | 51.6% | 636,042 |
| 2013 | 230,357 | 36.9% | 74,382 | 11.9% | 319,677 | 51.2% | 624,416 |
| 2012 | 227,626 | 36.8% | 77,150 | 12.5% | 313,530 | 50.7% | 618,306 |
| 2011 | 229,556 | 38.2% | 71,138 | 11.8% | 300,016 | 49.9% | 600,710 |
| 2010 | 231,339 | 38.1% | 86,382 | 14.2% | 289,797 | 47.7% | 607,518 |
| 2009 | 239,070 | 39.5% | 91,148 | 15.1% | 274,883 | 45.4% | 605,101 |
| 2008 | 248,490 | 38.0% | 88,362 | 13.5% | 317,136 | 48.5% | 653,988 |
| 2007 | 252,125 | 39.4% | 100,899 | 15.8% | 286,849 | 44.8% | 639,873 |
| 2006 | 254,498 | 38.8% | 105,684 | 16.1% | 295,306 | 45.1% | 655,488 |
| 2005 | 265,050 | 39.4% | 136,237 | 20.2% | 272,187 | 40.4% | 673,474 |
| 2004 | 274,396 | 41.9% | 141,967 | 21.7% | 238,484 | 36.4% | 654,847 |
| 2003 | 292,899 | 43.2% | 154,524 | 22.8% | 230,041 | 34.0% | 677,464 |
| 2002 | 317,573 | 48.0% | 143,463 | 21.7% | 199,964 | 30.3% | 661,000 |
| 2001 | 324,723 | 49.6% | 138,693 | 21.2% | 191,843 | 29.3% | 655,259 |
| 2000 | 325,816 | 49.5% | 163,789 | 24.9% | 169,105 | 25.7% | 658,710 |
| 1999 | 301,966 | 47.5% | 193,327 | 30.4% | 140,905 | 22.1% | 636,198 |
| 1998 | 317,816 | 49.3% | 221,984 | 34.4% | 104,650 | 16.2% | 644,450 |
| 1997 | 322,242 | 50.0% | 244,623 | 38.0% | 77,628 | 12.0% | 644,493 |
| 1996 | 316,201 | 48.7% | 268,806 | 41.4% | 63,996 | 9.9% | 649,003 |
| 1995 | 320,372 | 49.9% | 264,530 | 41.2% | 56,864 | 8.9% | 641,766 |
| 1994 | 320,369 | 48.1% | 296,508 | 44.5% | 49,192 | 7.4% | 666,069 |
| 1993 | 342,762 | 51.0% | 285,565 | 42.5% | 43,359 | 6.5% | 671,686 |
| 1992 | 331,638 | 49.9% | 299,652 | 45.1% | 33,056 | 5.0% | 664,346 |
| 1991 | 336,931 | 49.3% | 316,115 | 46.2% | 30,723 | 4.5% | 683,769 |
| 1990 | 336,154 | 48.3% | 320,829 | 46.1% | 39,454 | 5.7% | 696,437 |
| 1989 | 336,876 | 47.3% | 329,020 | 46.2% | 46,708 | 6.6% | 712,604 |
| 1988 | 365,354 | 51.5% | 306,247 | 43.2% | 37,217 | 5.3% | 708,818 |
| 1987 | 386,676 | 56.8% | 260,843 | 38.3% | 33,395 | 4.9% | 680,914 |
| 1986 | 402,230 | 59.4% | 237,508 | 35.1% | 36,877 | 5.5% | 676,615 |
| 1985 | 398,280 | 61.8% | 210,647 | 32.7% | 35,408 | 5.5% | 644,335 |
| 1984 | 369,225 | 58.3% | 210,450 | 33.2% | 53,262 | 8.4% | 632,937 |
| 1983 | 377,125 | 61.4% | 189,538 | 30.8% | 47,991 | 7.8% | 614,654 |
| 1982 | 365,962 | 61.4% | 196,462 | 33.0% | 33,553 | 5.6% | 595,977 |
** California totals may also include minor amounts from North Dakota and Gulf Coast States.
Source: California Energy Commission, aggregated from Petroleum Industry Information Reporting Act data. Please note that total of foreign oil receipts to refineries will not match that shown on other pages. The Petroleum Industry Information Reporting Act (PIIRA) data gives the breakdown by foreign, California and Alaska but not the foreign countries. The PIERS data includes the foreign breakdown by country but no domestic receipts. U.S. Dept. of Commerce, U.S. Dept. of Energy, Army Corps of Engineers, and State Lands Commission all give different totals by different breakdowns.
Categories
Topic
Division