December 2021
When water is scarce, California saves hydropower for when the grid needs reliable, clean energy most.
California is in the grip of a deep drought. Less water means low hydropower (hydro) availability, a key zero-carbon energy resource. In the spring and summer months of 2021, California generated less hydropower than in any of the six previous years. When water is scarce however, California reserves hydro for use during the summer to maintain grid reliability and to offset power plants with the highest greenhouse gas (GHG) emissions.*
In wet years, hydro plants generate more power during the spring runoff season, as shown in the following figure. In dry years, the opposite is true: hydro operators store water in reservoirs to use when demand for power, electricity prices, and fuel consumption peak. For example, Pacific Gas & Electric “reduced springtime generation in order to maximize reservoir storage and [use] flexible generation on higher demand months [and] highest demand hours.” Hydro output increased by over 500 gigawatt-hours (GWh), or 20 percent, from spring to summer in 2021.
California saves water for summer during drought years
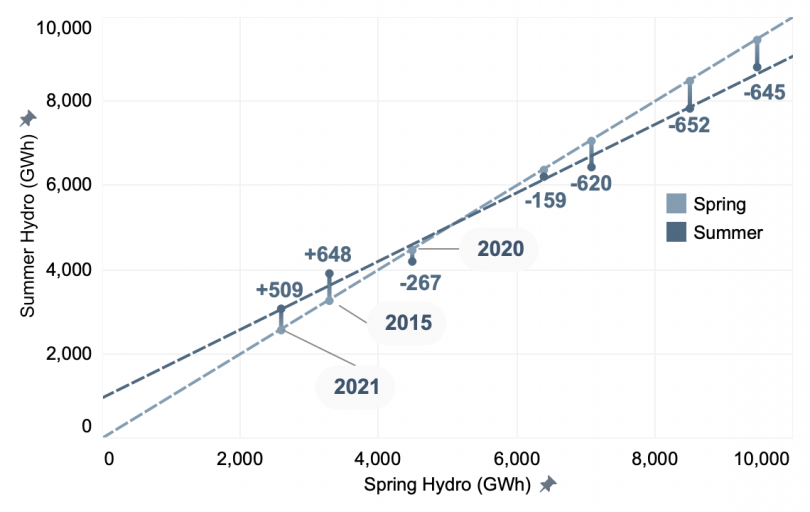
Source: California Energy Commission (CEC) analysis of California Independent System Operator (ISO) data. See Table 1 for details.
Even so, hydro was historically low this past summer. Past hydropower shortages have been made up with natural gas generation, increasing GHG emissions. However, the rapid mobilization of renewable energy and energy storage reduces California’s long-term reliance on natural gas, especially during periods of drought. Although 2021 was even drier than 2015, California generated 15 percent less electricity from natural gas because renewables carried more of the load.
The increase in renewable energy allows hydro to serve as a peaking resource under drought conditions, as seen in the graph below. On high-demand summer days of 2015, hydropower increased throughout the day and peaked in the evening at 4.1 gigawatts (GW). By 2021, grid-scale renewables, particularly solar, enabled hydro to reduce midday generation and generate more power around the net demand peak. Peak hydro generation on the highest demand days of 2021 surpassed 4.3 GW — an increase from 2015 despite a 20 percent decrease in hydro production.
As renewable penetration increases, hydropower is used as a clean peaking generation resource
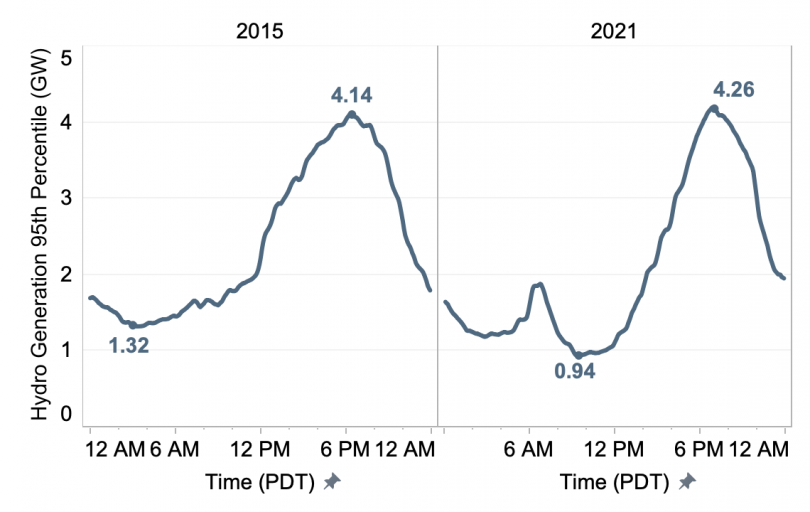
Source: CEC analysis of California ISO data
By storing water early in the year and reducing midday generation, hydro can be deployed when a reliable energy resource is needed to offset natural gas plants. This strategic use can be seen in the wholesale energy value of hydro. When water is abundant, hydropower generation mirrors net demand and earns roughly the average energy price, as it did during the summer of 2019. When water is scarce, reserves ensure it is used when wholesale prices are highest, which means hydro resources are being used to maintain a reliable grid and to meet the state’s climate goals.
California maximizes the value of hydropower during drought years.
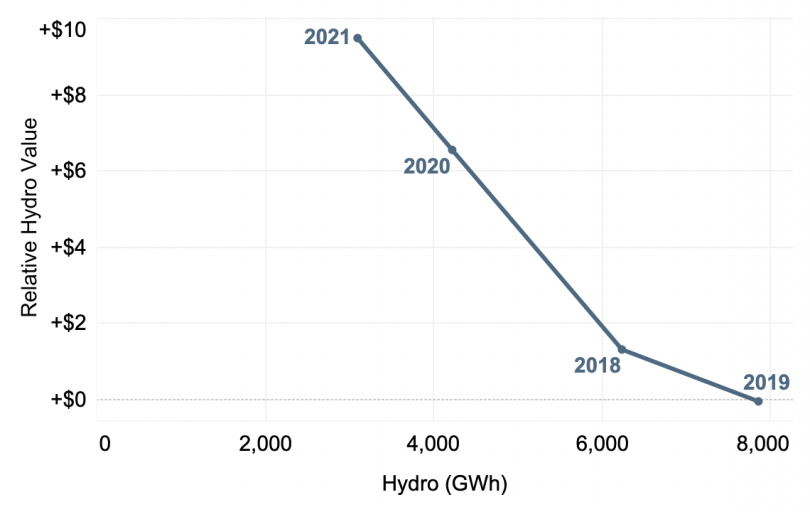
Source: CEC analysis of California ISO data. See Table 2 for details.
More water is always better when operating a clean, reliable electric grid. However, renewable energy growth means hydro can be saved for when it is needed.
*“California” refers to the electric grid managed by the California Independent System Operator (ISO). The ISO grid represents roughly 80 percent of California’s total electric load. California also manages water for other benefits including irrigation, municipal water supply, flood control, recreation, and fish and wildlife habitat.
Table 1. Total summer (July–September) hydroelectric generation relative to spring (April–June, from wettest to driest.
| Year | Spring Hydro (GWh) | Summer Hydro (GWh) | Difference (GWh) |
|---|---|---|---|
| 2017 (Wettest) | 9,472 | 8,827 | -645 |
| 2019 | 8,497 | 7,845 | -652 |
| 2016 | 7,073 | 6,452 | -620 |
| 2018 | 6,384 | 6,225 | -159 |
| 2020 | 4,478 | 4,211 | -267 |
| 2015 | 3,278 | 3,926 | +648 |
| 2021 (Driest) | 2,580 | 3,088 | +509 |
Table 2. Percentage difference in average hydro value and average 5-minute real-time market wholesale price for summer 2018 through 2021.
| Year | Hydro (GWh) | Average Energy Price ($/MWh)1 |
Hydro Value ($/MWh)2 |
Relative Hydro Value ($/MWh) |
|---|---|---|---|---|
| 2019 (Wettest) | 7,845 | $34.22 | $34.19 | -$0.02 |
| 2018 | 6,225 | $46.37 | $47.75 | +$1.38 |
| 2020 | 4,211 | $37.96 | $44.61 | +$6.65 |
| 2021 (Driest) | 3,088 | $58.93 | $68.55 | +$9.62 |
- System marginal energy cost weighted by total load.
- System marginal energy cost weighted by hydro generation.