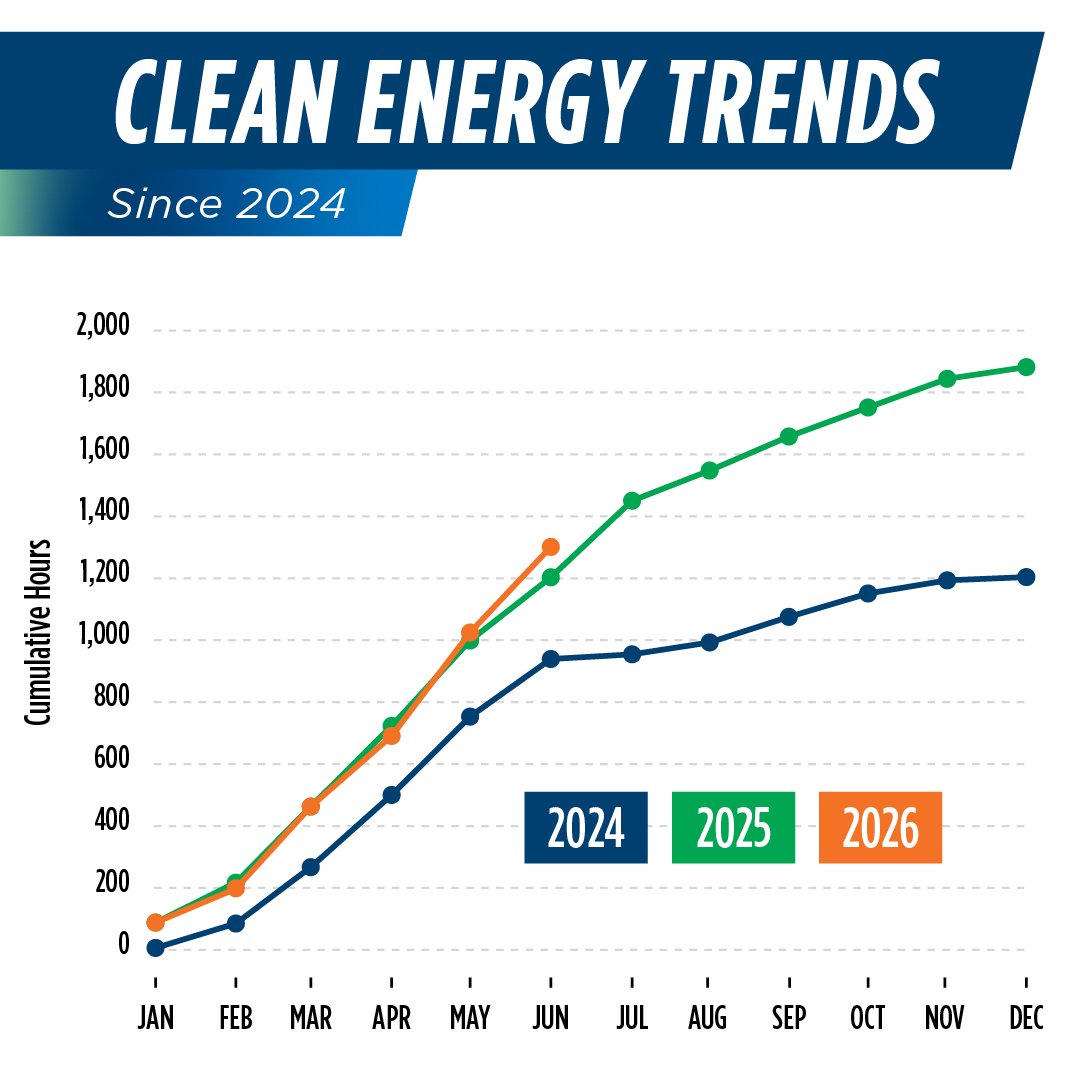
California continues to lead the nation in bringing clean energy online. Each year, more hours of the day are powered entirely by clean energy. These milestones show how the state’s sustained investments in clean energy and a rapidly growing battery storage fleet are paying off.
The data below show how often clean energy meets or exceeds demand on the California Independent System Operator (California ISO) grid, which manages about 80 percent of the state’s electricity.
California Independent System Operator Clean Energy Calculations Since 2022
| Year | Total Hours | Equivalent Days | Average Hours Per Day Based on Calendar Days | Max Daily (hours) | Days when 100% clean energy met or exceeded demand for a portion of the day |
|---|---|---|---|---|---|
| 2022 | 147 | 6.1 | 0.4 | 9.4 | 43 |
| 2023 | 687.50 | 28.6 | 1.9 | 10.1 | 136 |
| 2024 | 1,226.75 | 51.1 | 3.4 | 11.1 | 219 |
| 2025 | 1,856.08 | 77.3 | 5.1 | 11.3 | 279 |
| Through June 2026 | 1,306 | 54 | 7.2 | 11 | 166 |
Monthly Breakdown
| 2026 | Days clean energy met or exceeded demand for a portion of the day | Total Hours |
|---|---|---|
| January | 22 | 102.6 |
| February | 23 | 139.6 |
| March | 30 | 223 |
| April | 30 | 268 |
| May | 31 | 297 |
| June | 30 | 276 |
| 2025 | Days clean energy met or exceeded demand for a portion of the day | Total Hours |
|---|---|---|
| January | 25 | 111.42 |
| February | 25 | 145.42 |
| March | 27 | 211.58 |
| April | 30 | 261.67 |
| May | 31 | 270.08 |
| June | 30 | 245.58 |
| July | 30 | 200.58 |
| August | 19 | 100.75 |
| September | 17 | 87.92 |
| October | 25 | 131.5 |
| November | 13 | 58 |
| December | 7 | 31.75 |
Trends Since 2024
About the data
Throughout the course of the year, the number of clean energy days varies. In the winter months, there is less demand for electricity but also fewer hours of daylight to produce solar energy, which is the largest source of clean energy on the grid. Spring is the peak of clean energy, when demand remains low but solar panels are taking advantage of increasing daylight hours. In the summer, demand for electricity to power air conditioners peaks. In the fall, both demand and solar production slowly taper down. As more battery storage comes online—including newer long-duration energy storage technology—along with additional clean energy innovations, these variations will level out and the grid will get closer and closer to 100% clean energy 100% of the time.
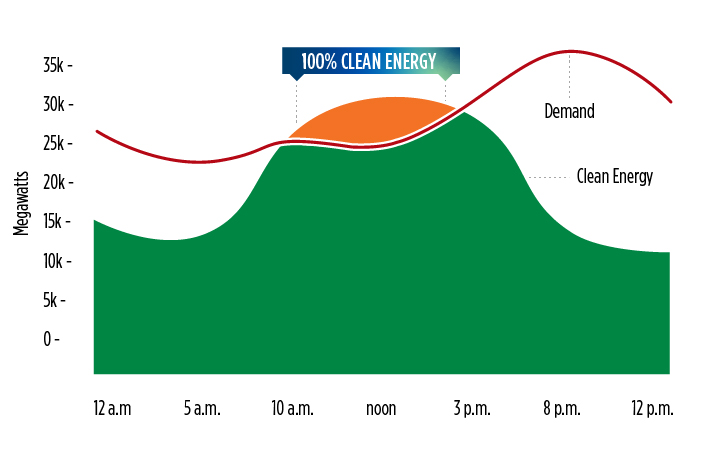
*This evaluation uses California ISO published data presented on CAISO’s Today Outlook website. Clean energy is measured in five-minute intervals and reflects the times when clean generation (solar, wind, hydro, nuclear, geothermal, and biomass) equals or exceeds published California ISO electricity demand. This data is provided for informational purposes only and should not be used for determining actual billing values, operational planning, or statewide progress in meeting California’s clean energy goals.
Clean energy sources counted include small hydro, solar, wind, biomass, geothermal, nuclear, and large hydro. The published California ISO demand evaluated does not include electricity consumed for pumping loads or to charge batteries and may not represent actual retail sales delivered to consumers. Renewables included from California ISO may not necessarily be certified for RPS compliance. In addition, the reported biomass supply may not reflect actual renewable generation as only the portion of the certified facility electricity generated from renewable feedstock would count as renewable electricity generation. California ISO’s Today’s Outlook data is subject to change without notice.