Depending on browser width, scrolling of table may be necessary. Scroll bar is at bottom of table.
| Fuel Type | California In-State Generation (GWh) | Percent of California In-State Generation | Northwest Imports (GWh) | Southwest Imports (GWh) | Total Imports (GWh) | Percent of Imports | Total California Energy Mix (GWh) | Total California Power Mix |
|---|---|---|---|---|---|---|---|---|
| Coal | 317 | 0.17% | 194 | 6,963 | 7,157 | 8.76% | 7,474 | 2.74% |
| Natural Gas | 92,298 | 48.35% | 70 | 8,654 | 8,724 | 10.68% | 101,022 | 37.06% |
| Oil | 30 | 0.02% | - | - | 0 | 0.00% | 30 | 0.01% |
| Other (Waste Heat / Petroleum Coke) | 384 | 0.20% | 125 | 9 | 134 | 0.16% | 518 | 0.19% |
| Nuclear | 16,280 | 8.53% | 672 | 8,481 | 9,154 | 11.21% | 25,434 | 9.33% |
| Large Hydro | 17,938 | 9.40% | 14,078 | 1,259 | 15,337 | 18.78% | 33,275 | 12.21% |
| Unspecified | - | 0.00% | 12,870 | 1,745 | 14,615 | 17.90% | 14,615 | 5.36% |
| Total Non-Renewables and Unspecified Energy | 127,248 | 66.65% | 28,009 | 27,111 | 55,120 | 67.50% | 182,368 | 66.91% |
| Biomass | 5,680 | 2.97% | 975 | 25 | 1,000 | 1.22% | 6,679 | 2.45% |
| Geothermal | 11,345 | 5.94% | 166 | 1,825 | 1,991 | 2.44% | 13,336 | 4.89% |
| Small Hydro | 3,476 | 1.82% | 320 | 2 | 322 | 0.39% | 3,798 | 1.39% |
| Solar | 29,456 | 15.43% | 284 | 6,312 | 6,596 | 8.08% | 36,052 | 13.23% |
| Wind | 13,708 | 7.18% | 11,438 | 5,197 | 16,635 | 20.37% | 30,343 | 11.13% |
| Total Renewables | 63,665 | 33.35% | 13,184 | 13,359 | 26,543 | 32.50% | 90,208 | 33.09% |
| Total System Energy | 190,913 | 100.00% | 41,193 | 40,471 | 81,663 | 100.00% | 272,576 | 100.00% |
Total System Electric Generation and Methodology
Total system electric generation is the sum of all utility-scale, in-state generation, plus net electricity imports. Items of note for 2020:
- Total generation for California was 272,576 gigawatt-hours (GWh), down 2 percent, or 5,356 GWh, from 2019.
- California's non-CO2 emitting electric generation categories (nuclear, large hydroelectric, and renewables) accounted for 51 percent of its in-state generation, compared to 57 percent in 2019. The change is directly attributable to the significantly reduced hydroelectric generation, some 44 percent lower than 2019 generation levels, as dry conditions returned to the state.
- Net imports increased by about 6 percent (4,435 GWh) in 2020 to 81,663 GWh, partially offsetting the decreased output from California’s hydroelectric power plants.
- Total renewable energy reached 33 percent, 90,2080 GWh in 2020, up 2.5 percent from 2019 levels.
Overall, California’s total grid-served electric generation continues to decline as local, distributed generation systems expanded across the state. Behind-the-meter residential rooftop solar photovoltaic systems directly reduce the measured delivery of power from the state’s fleet of utility-scale power plants.[1]
In 2020, California experienced the third driest year since year since 1895, as drought conditions returned to the state. Similarly, 2020 had the third highest annual average temperature recorded over the past 126-year record. As a result, annual hydroelectric generation fell by 44 percent from 2019 levels to 21,414 GWh. As shown in Figures 1 and 2, total monthly hydroelectric generation in 2020 neared the lowest historical monthly levels of the past 19 years of CEC generation data.
As detailed in Table 1 below, California’s natural gas-fired electric generation increased by 7 percent in 2020 to 92,298 GWh, accounting for 48 percent of in-state generation. In-state renewables (small hydro, geothermal, biomass, solar, and wind) decreased by 1.4 percent compared to 2019, due to decreased generation from biomass (plant retirements) and small hydroelectric generation (drought conditions); combined wind and solar generation were up by 2 percent over 2019 levels while geothermal generation was up 3.4 percent in 2020.
Looking ahead into 2021, hydroelectric generation continues into historically low levels for each of the first five months of the year for which there is available CAISO data, as shown in Figure 3. Please note, the CAISO dataset does not include hydroelectric facilities from other balancing areas such as those within LADWP and BANC (SMUD), unlike Figures 1 and 2.
Figure 1: Comparison of 2020 Hydroelectric Generation to Historical Highs and Lows
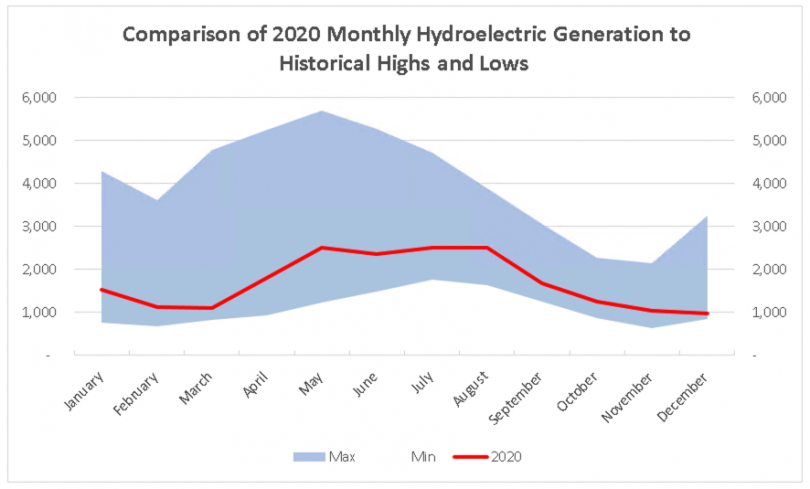
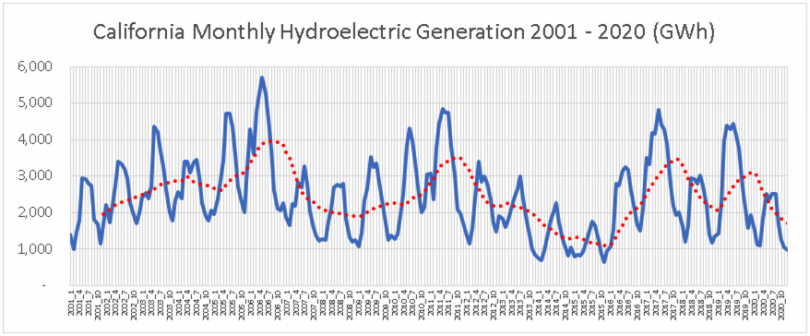
Figure 3: CAISO Monthly Hydroelectric Generation, January 2021 – May 2021
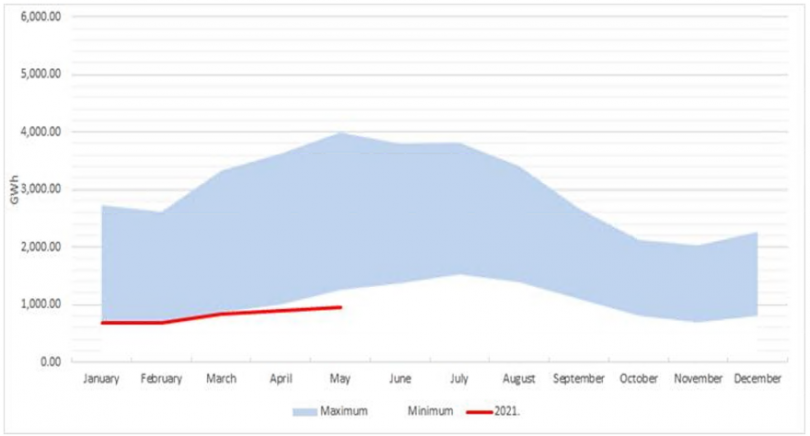
Table 1 – California Electric Generation and Net Imports, 2016-2020
| 2016 GWh | 2017 GWh | 2018 GWh | 2019 GWh | 2020 GWh | |
|---|---|---|---|---|---|
| Total System Electric Generation | 290,792 | 292,083 | 285,656 | 277,933 | 272,576 |
| Total In-State Generation | 198,466 | 206,379 | 195,008 | 200,704 | 190,913 |
| CA Hydroelectric | 28,986 | 43,304 | 26,344 | 38,494 | 21,414 |
| CA Large Hydro | 24,410 | 36,920 | 22,096 | 33,145 | 17,938 |
| CA Small Hydro | 4,576 | 6,384 | 4,248 | 5,349 | 3,476 |
| CA Nuclear | 18,931 | 17,925 | 18,268 | 16,163 | 16,280 |
| CA Coal | 324 | 302 | 294 | 250 | 317 |
| CA Oil | 37 | 33 | 35 | 36 | 30 |
| CA Natural Gas | 98,879 | 89,588 | 90,691 | 86,134 | 92,298 |
| CA Geothermal | 11,582 | 11,745 | 11,528 | 10,967 | 11,345 |
| CA Biomass | 5,905 | 5,847 | 5,909 | 5,936 | 5,680 |
| CA Wind | 13,499 | 12,867 | 14,244 | 13,688 | 13,708 |
| CA Solar PV | 17,385 | 21,895 | 24,721 | 26,323 | 27,179 |
| CA Solar Thermal | 2,548 | 2,464 | 2,545 | 2,303 | 2,277 |
| CA Petroleum Coke | 207 | 246 | 207 | 191 | 197 |
| CA Waste Heat | 182 | 163 | 223 | 220 | 187 |
| Net Imports | 92,326 | 85,704 | 90,648 | 77,229 | 81,663 |
The California Code of Regulations (Title 20, Division 2, Chapter 2, Section 1304 (a)(1)-(2)) requires owners of power plants that are 1 MW or larger in California or within a control area with end users inside California to file data on electric generation, fuel use, and environmental attributes. Reports are submitted to the Energy Commission on a quarterly and annual basis. These reports cover all forms of electric generation including renewables, hydroelectric, natural gas, and others. The reporting requirement includes electricity from facilities that generate for onsite usage such as refineries and university campuses. Additionally, loads from hydroelectric facilities that are equipped with reversible turbines (a combined pump and turbine generator) are taken into account. Pumping-generating facilities use electricity to meet water storage, water transfer, and water delivery requirements, while pumped storage facilities use electricity to transfer water from one reservoir to another, usually during off-peak hours at night, so that electricity can be generated during the next day to help peak electricity demand. Energy Commission staff collect and verify these reports to compile a statewide accounting of all electric generation serving California.
Quarterly data reports submitted by balancing authorities for energy imports and exports are used to determine the net energy imports for California. Imports are tracked for two geographical regions: the Northwest and the Southwest. The allocation of fuel types is based on Power Source Disclosure reports from LSEs such as investor-owned utilities, publicly owned utilities, and community-choice aggregators.
What is Unspecified Power?
Unspecified power refers to electricity that is not traceable to a specific generating facility, such as electricity traded through open market transactions. Unspecified sources of power are typically a mix of resource types, and may include renewables. This category can also include spot market purchases, wholesale energy purchases, and purchases from pools of electricity where the original source of fuel can no longer be determined. As mentioned, it can also include renewable energy from a certified renewable facility that has been sold separately from its renewable attributes, or RECs. Renewable energy without its corresponding RECs is sometimes referred to as “null energy.”
Definitions
California Energy Mix: Total in-state electric generation plus Northwest and Southwest energy imports
California Power Mix: Percentage of specified fuel types derived from the California Energy Mix for use on the annual Power Content Label
In-State Generation: Energy from power plants physically located in the state of California
Northwest Imports: Energy imports from Alberta, British Columbia, Idaho, Montana, Oregon,South Dakota, Washington, and Wyoming
Southwest Imports: Energy imports from Arizona, Baja California, Colorado, Mexico, Nevada,New Mexico, Texas, and Utah
Total System Electric Generation: Used interchangeably with California Energy Mix
Total System Power: Original terminology used to describe California’s annual electric generation.
____________________________
[1] Note, data reporting requirements for total system electric generation are limited to those facilities with a nameplate capacity of 1 MW and larger. As most solar PV systems installed on residential homes and commercial buildings are less than 1 MW, they are typically considered to be distributed generation and not required to report to the CEC.