These tables and corresponding charts are provided to show the total installed electric generation nameplate capacity of all power plants one megawatt (MW) and larger located within California, and the corresponding generation from these resources. The data is collected under the authority of the California Code of Regulations, Title 20, Division 2, Chapter 3, Section 1304(a)(1)-(2). Data reflects the CEC-1304 QFER Database as of June 16, 2026.
Download data for Electric Generation Capacity Energy - Excel
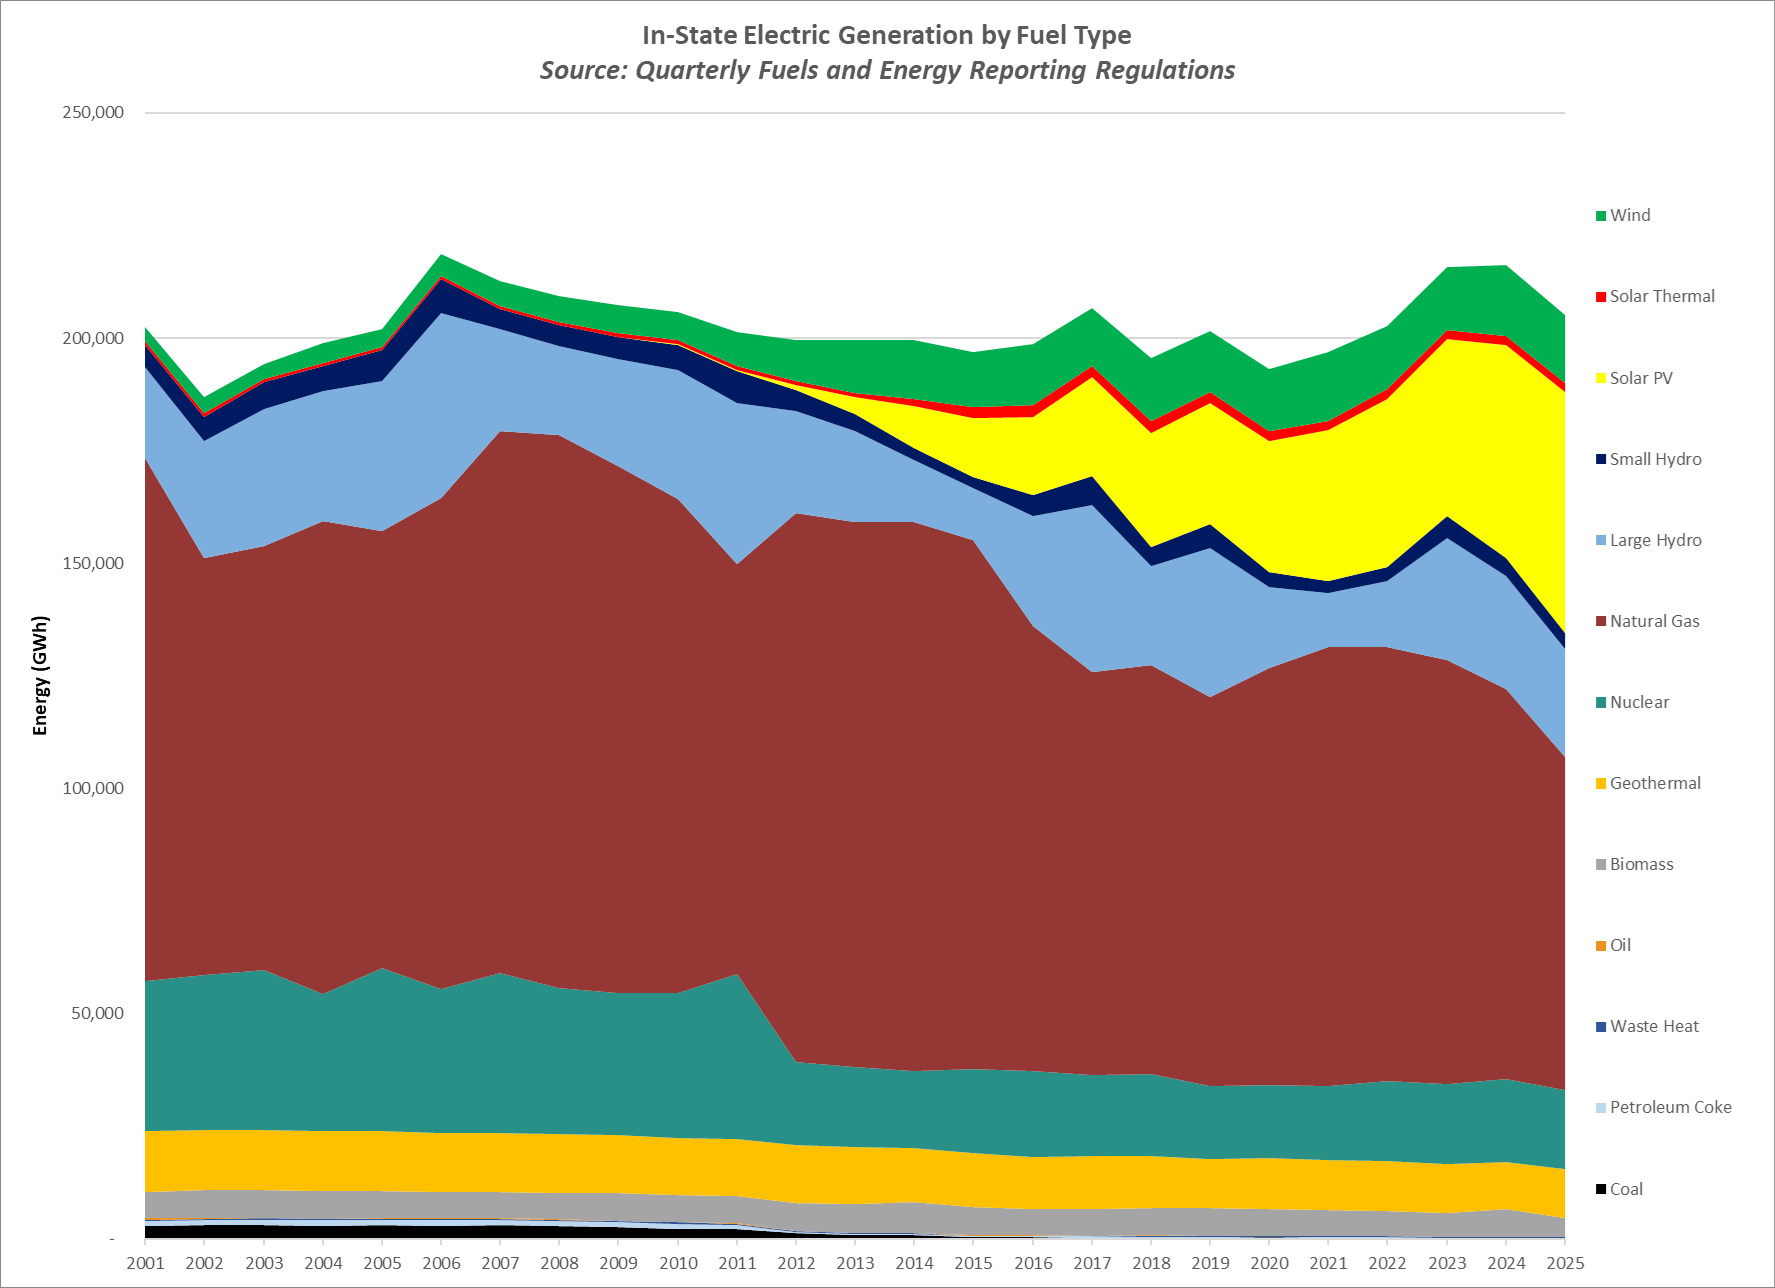
In-State Electric Generation by Fuel Type (GWh)
| Primary Fuel Type | 2025 | 2024 | 2023 | 2022 | 2021 |
|---|---|---|---|---|---|
| Coal | 244 | 263 | 257 | 273 | 303 |
| Petroleum Coke | - | - | - | 100 | 204 |
| Biomass | 4,226 | 6,142 | 5,205 | 5,592 | 5,631 |
| Geothermal | 10,908 | 10,453 | 10,999 | 11,123 | 11,116 |
| Nuclear | 17,575 | 18,379 | 17,714 | 17,627 | 16,477 |
| Natural Gas | 73,750 | 86,506 | 94,215 | 96,496 | 97,488 |
| Large Hydro | 24,125 | 25,222 | 27,066 | 14,607 | 12,036 |
| Small Hydro | 3,417 | 3,968 | 4,833 | 3,013 | 2,505 |
| Solar PV | 53,642 | 47,194 | 39,304 | 37,389 | 33,569 |
| Solar Thermal | 1,886 | 2,064 | 1,923 | 2,102 | 2,065 |
| Wind | 15,172 | 15,761 | 13,920 | 14,095 | 15,339 |
| Waste Heat | 157 | 198 | 206 | 215 | 178 |
| Oil | 31 | 36 | 36 | 65 | 39 |
| Total | 205,132 | 216,185 | 215,678 | 202,696 | 196,950 |
Installed In-State Electric Generation Capacity by Fuel Type (MW)
| Primary Fuel Type | 2025 | 2024 | 2023 | 2022 | 2021 |
|---|---|---|---|---|---|
| Coal | 63 | 63 | 63 | 63 | 63 |
| Petroleum Coke | - | - | - | 36 | 36 |
| Biomass | 1,163 | 1,278 | 1,281 | 1,284 | 1,281 |
| Geothermal | 2,715 | 2,715 | 2,715 | 2,709 | 2,664 |
| Nuclear | 2,393 | 2,393 | 2,393 | 2,393 | 2,393 |
| Natural Gas | 38,571 | 38,576 | 39,665 | 39,546 | 39,433 |
| Large Hydro | 12,241 | 12,281 | 12,281 | 12,281 | 12,281 |
| Small Hydro | 1,686 | 1,726 | 1,753 | 1,753 | 1,755 |
| Solar PV | 23,749 | 22,291 | 19,973 | 16,681 | 14,981 |
| Solar Thermal | 892 | 984 | 984 | 984 | 1,249 |
| Wind | 6,330 | 6,360 | 6,284 | 6,163 | 6,228 |
| Waste Heat | 48 | 48 | 52 | 52 | 52 |
| Oil | 351 | 351 | 351 | 351 | 352 |
| Total | 90,201 | 89,064 | 87,795 | 84,296 | 82,768 |
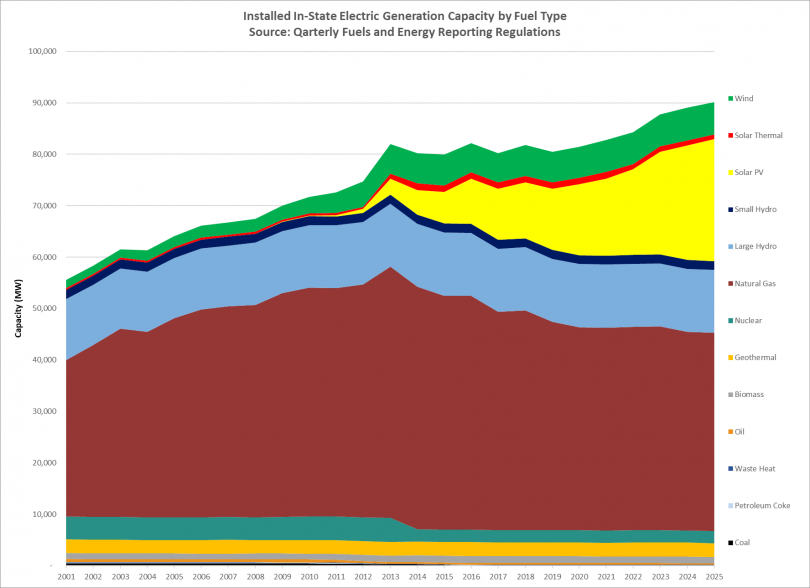
Source: QFER CEC-1304 Power Plant Data Reporting
* Note: Operational capacity as of December 31 of each year. Does not include plants that retired within the year.
The information in these charts and tables is based on metering at each power plant site and, therefore, does not account for the 7-8 percent (typical) loss attributed to transmission for delivery to the customer's meter. In addition, the information includes both retail sales and non-retail sales such as water delivery and pumped storage. The information cannot be used to determine progress toward the Renewables Portfolio Standard due to these differences.
The information does not include power plants with a nameplate capacity of less than one megawatt and does not include distributed generation such as residential solar photovoltaic installations, backup power generators, or imported energy from surrounding control areas. Data is subject to change based on revisions and quality control checks.
For more information, visit the Renewables Portfolio Standard.