(Updated as of April 2025)
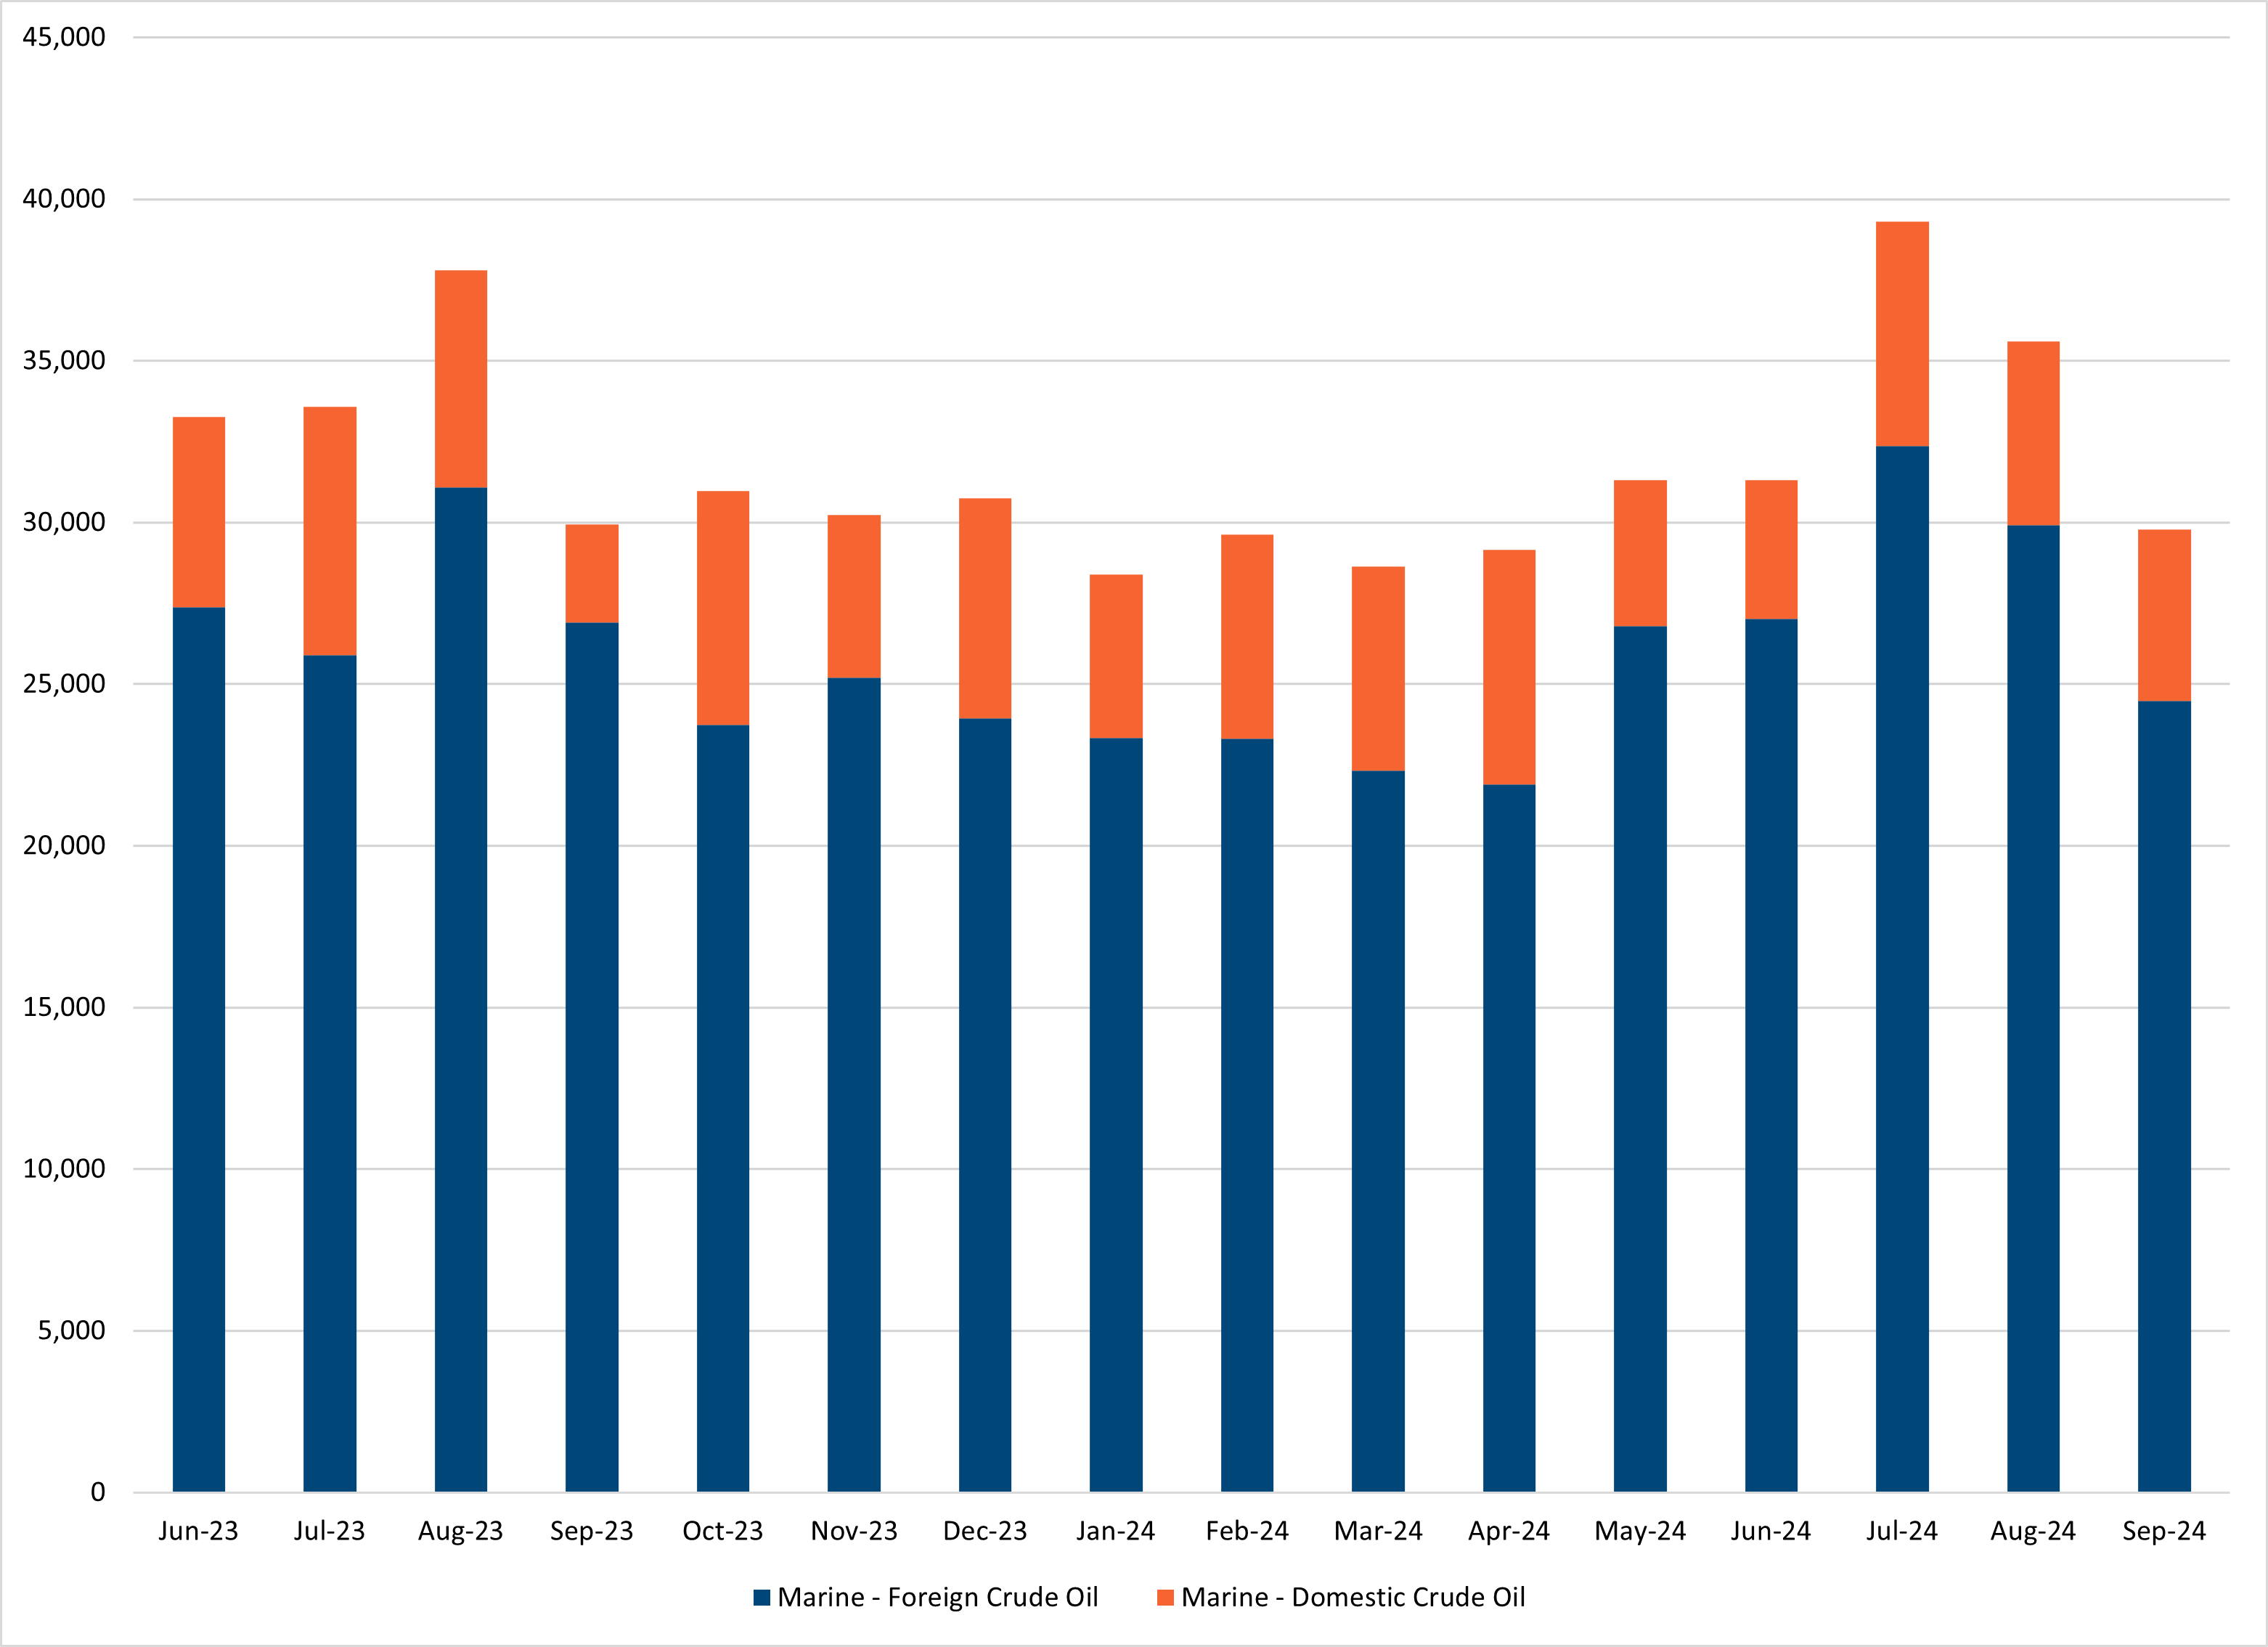
| Date | Marine - Foreign Crude Oil | Marine - Domestic Crude Oil | Total Imports |
|---|---|---|---|
| September 2024 | 24,482 | 5,290 | 29,772 |
| August 2024 | 29,912 | 5,677 | 35,589 |
| July 2024 | 32,361 | 6,948 | 39,309 |
| June 2024 | 27,011 | 4,296 | 31,307 |
| May 2024 | 26,787 | 4,515 | 31,355 |
| April 2024 | 21,910 | 7,233 | 29,203 |
| March 2024 | 22,321 | 6,316 | 28,693 |
| February 2024 | 23,310 | 6,305 | 29,670 |
| January 2024 | 23,329 | 5,064 | 28,447 |
| December 2023 | 23,942 | 6,805 | 30,803 |
| November 2023 | 25,198 | 5,029 | 30,282 |
| October 2023 | 23,734 | 7,228 | 31,016 |
| September 2023 | 26,905 | 3,032 | 29,991 |
| August 2023 | 31,076 | 6,723 | 37,858 |
| July 2023 | 25,894 | 7,689 | 33,639 |
| June 2023 | 27,382 | 5,874 | 33,256 |
Source:
- In thousands of barrels.
- California Energy Commission data, produced from Petroleum Industry Information Reporting Act (PIIRA), The Port Import/Export Reporting Service (PIERS), and State Lands Commission (SLC).
- Please note that total California crude oil imports will not match that shown on other pages. The PIERS, PIIRA, and SLC data all give different totals by different breakdowns. This graph is the result of staff analysis reconciling between those sources.