The Petroleum Industry Information Reporting Act (PIIRA) requires all retail transportation fueling stations in California to file a Retail Fuel Outlet Annual Report (CEC-A15) with the California Energy Commission (CEC). These stations report retail sales of gasoline, diesel, and other transportation fuels.
- A15 sales data represents nearly 87 percent of total gasoline consumed in California.
- A15 survey response totals will not reach 100 percent of estimated total consumption of gasoline from one year to the next due to various reasons.
- Not all locations dispensing fuel to end-users are required to report sales to the CEC, estimated to be 5 to 8 percent of statewide totals.
- Not all retail locations respond to the survey, estimated 2 to 5 percent of statewide volume.
Number of Retail Fuel Stations by Fuel – Survey Responses
| Reporting Year | Gasoline | Diesel5 | E851 | Propane | Natural Gas2 | Total Stations Survey Responses* | Total Stations Estimated |
|---|---|---|---|---|---|---|---|
| 2010 | 7,707 | 3,715 | 36 | 679 | 42 | 7,965 | 9,800 |
| 2011 | 8,036 | 3,942 | 42 | 809 | 48 | 8,343 | 9,710 |
| 2012 | 7,748 | 3,847 | 51 | 805 | 32 | 8,038 | 10,219 |
| 2013 | 7,044 | 3,579 | 59 | 699 | 46 | 7,293 | 10,076 |
| 2014 | 6,369 | 3,416 | 56 | 714 | 29 | 6,594 | 10,080 |
| 2015 | 7,240 | 4,095 | 81 | 573 | 139 | 7,516 | 10,309 |
| 2016 | 8,456 | 4,790 | 111 | 651 | 164 | 8,924 | 10,481 |
| 2017 | 8,353 | 4,854 | 127 | 349 | 142 | 8,872 | 10,353 |
| 2018 | 8,256 | 4,873 | 148 | 381 | 155 | 8,684 | 10,266 |
| 2019 | 8,269 | 4,958 | 181 | 301 | 121 | 8,713 | 10,449 |
| 2020 | 8,680 | 5,224 | 238 | 323 | 168 | 9,063 | 10,862 |
| 2021 | 7,997 | 4,966 | 287 | 307 | 164 | 8,435 | 10,423 |
| 2022 | 8,161 | 5,305 | 322 | 245 | 188 | 8,641 | 10,742 |
| 2023 | 8,435 | 5,511 | 368 | 266 | 204 | 8,947 | 10,957 |
| 2024 | 8,611 | 5,632 | 489 | 213 | 186 | 9,117 | 11,084 |
Source: California Energy Commission
*Stations by fuel type will not equal total respondents due to stations often dispensing multiple fuel types.
Retail Sales Volumes – Survey Responses (Million Gallons)
| Reporting Year | Gasoline | Diesel | E851 | Propane | Natural Gas2 |
|---|---|---|---|---|---|
| 2010 | 12,238 | 1,285 | 2.00 | 32.64 | 4.09 |
| 2011 | 12,644 | 1,346 | 3.89 | 19.82 | 7.26 |
| 2012 | 12,241 | 1,327 | 5.12 | 25.44 | 6.60 |
| 2013 | 11,418 | 1,261 | 7.31 | 13.99 | 6.17 |
| 2014 | 10,220 | 1,226 | 4.99 | 18.23 | 3.94 |
| 2015 | 12,044 | 1,592 | 11.99 | 13.83 | 41.19 |
| 2016 | 13,787 | 1,743 | 16.85 | 9.09 | 45.16 |
| 2017 | 13,936 | 1,717 | 23.01 | 6.24 | 45.61 |
| 2018 | 13,578 | 1,602 | 32.04 | 4.04 | 37.82 |
| 2019 | 13,473 | 1,559 | 37.25 | 3.16 | 17.57 |
| 2020 | 11,262 | 1,560 | 34.86 | 3.51 | 41.1 |
| 2021 | 11,618 | 1,611 | 55.35 | 3.46 | 46.87 |
| 2022 | 11,495 | 1,846 | 91.45 | 2.49 | 52.97 |
| 2023 | 11,685 | 2,016 | 95.25 | 1.74 | 85.65 |
| 2024 | 11,681 | 1,904 | 101.8 | 1.44 | 61.17 |
Source: California Energy Commission
A15 Report Responses vs. California Department of Tax and Fee Administration (CDTFA) (Million Gallons)
| Reporting Year | CEC-A15 Reported Gasoline Volumes | % Differences | CDTFA3 Gasoline Taxable | CEC-A15 Reported Diesel Volumes | CDTFA4 Taxable Diesel Sales |
|---|---|---|---|---|---|
| 2010 | 12,238 | 17.6 % | 14,861 | 1,285 | 2,590 |
| 2011 | 12,644 | 13.4 % | 14,606 | 1,346 | 2,622 |
| 2012 | 12,241 | 12.7 % | 14,486 | 1,327 | 2,603 |
| 2013 | 11,394 | 21.6 % | 14,540 | 1,261 | 2,740 |
| 2014 | 10,220 | 30.4 % | 14,701 | 1,226 | 2,776 |
| 2015 | 12,044 | 20.3 % | 15,108 | 1,592 | 2,825 |
| 2016 | 13,787 | 11.0 % | 15,492 | 1,743 | 3,005 |
| 2017 | 13,936 | 10.6 % | 15,584 | 1,717 | 3,124 |
| 2018 | 13,475 | 12.9 % | 15,471 | 1,601 | 3,074 |
| 2019 | 13,473 | 12.3% | 15,365 | 1,559 | 3,086 |
| 2020 | 11,262 | 10.4% | 12,572 | 1,560 | 2,979 |
| 2021 | 11,618 | 15.9% | 13,818 | 1,611 | 3,141 |
| 2022 | 11,495 | 15.7% | 13,640 | 1,846 | 3,067 |
| 2023 | 11,685 | 13.9% | 13,576 | 2,016 | 2,982 |
| 2024 | 11,681 | 13.0% | 13,423 | 1,904 | 2,968 |
Source: California Energy Commission
Note: CDTFA tracks all gasoline and diesel sales in California for taxation purposes, but accounts for those sales at the finished fuel terminal level where taxation first occurs. Because of this, CDTFA gasoline and diesel sales have no regional dimension available. The CEC-A15 tracks fuel sales at the retail level, station by station, but since the current number of stations is constantly changing and the full station population is unknown, staff uses the total known CDTFA gasoline and diesel sales figures as a benchmark to achieve in data collection efforts. Differences in these two figures estimate the amount of sales underreported in CEC-A15 results.
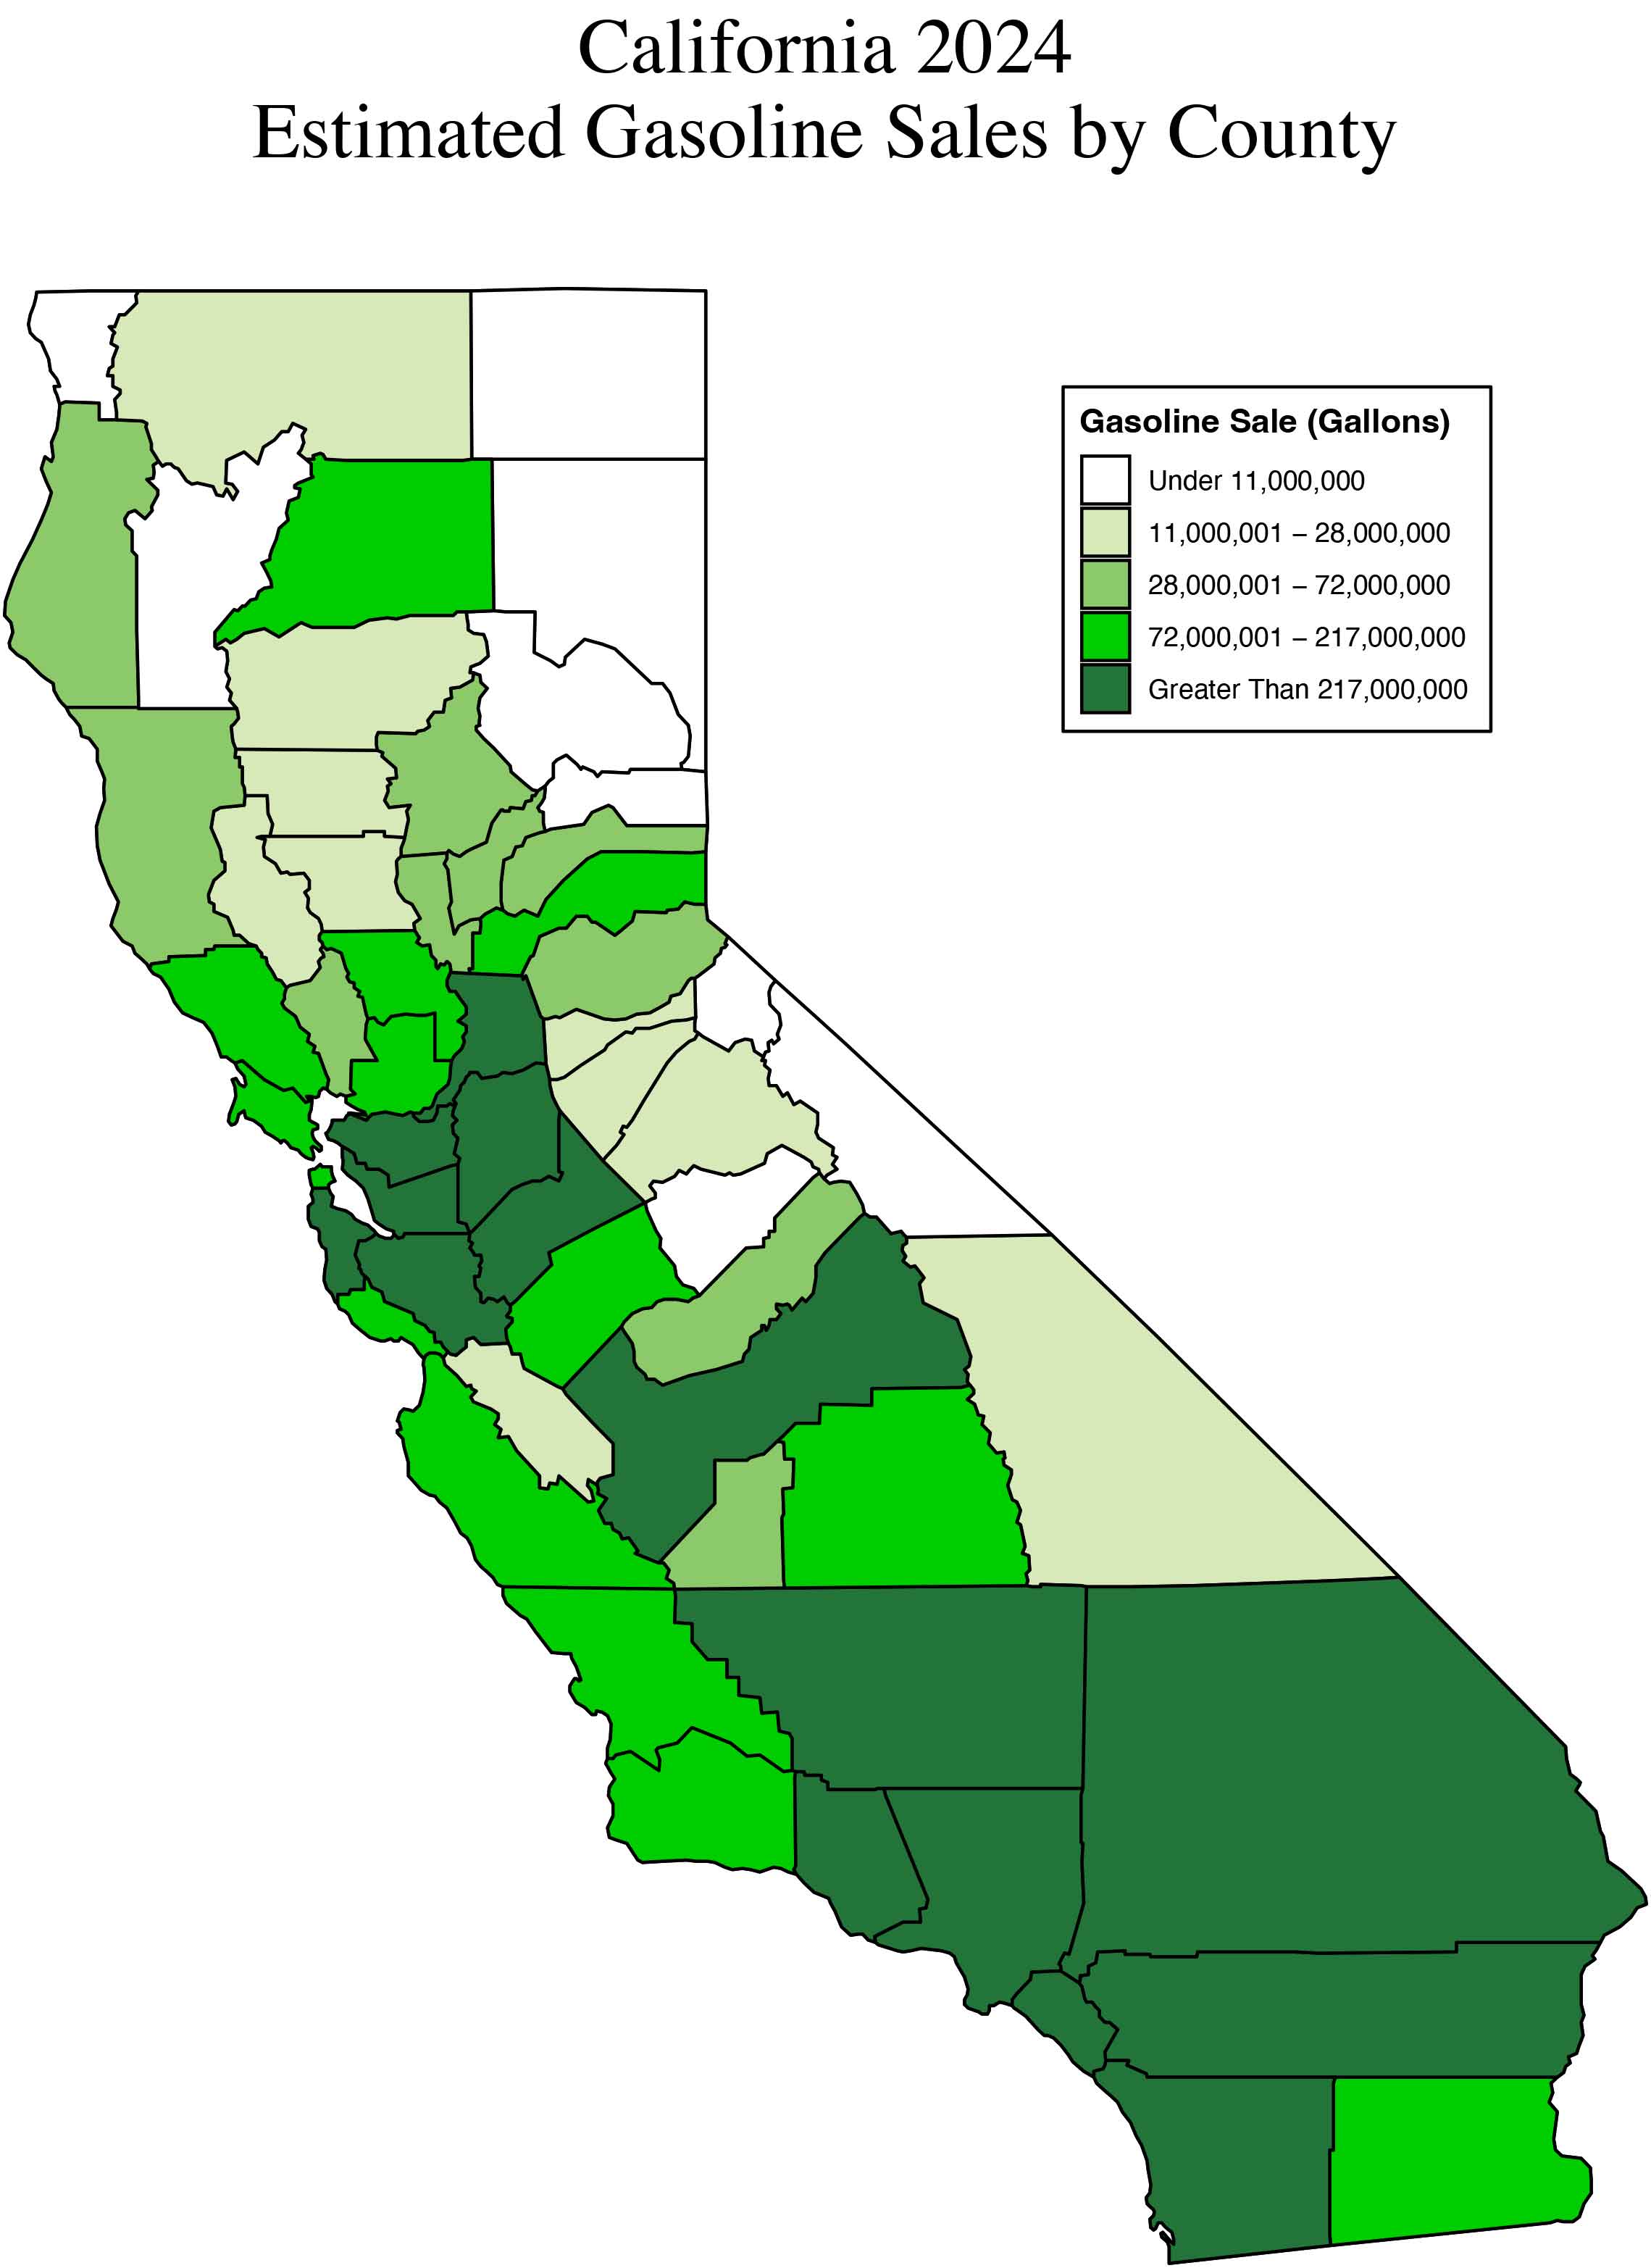
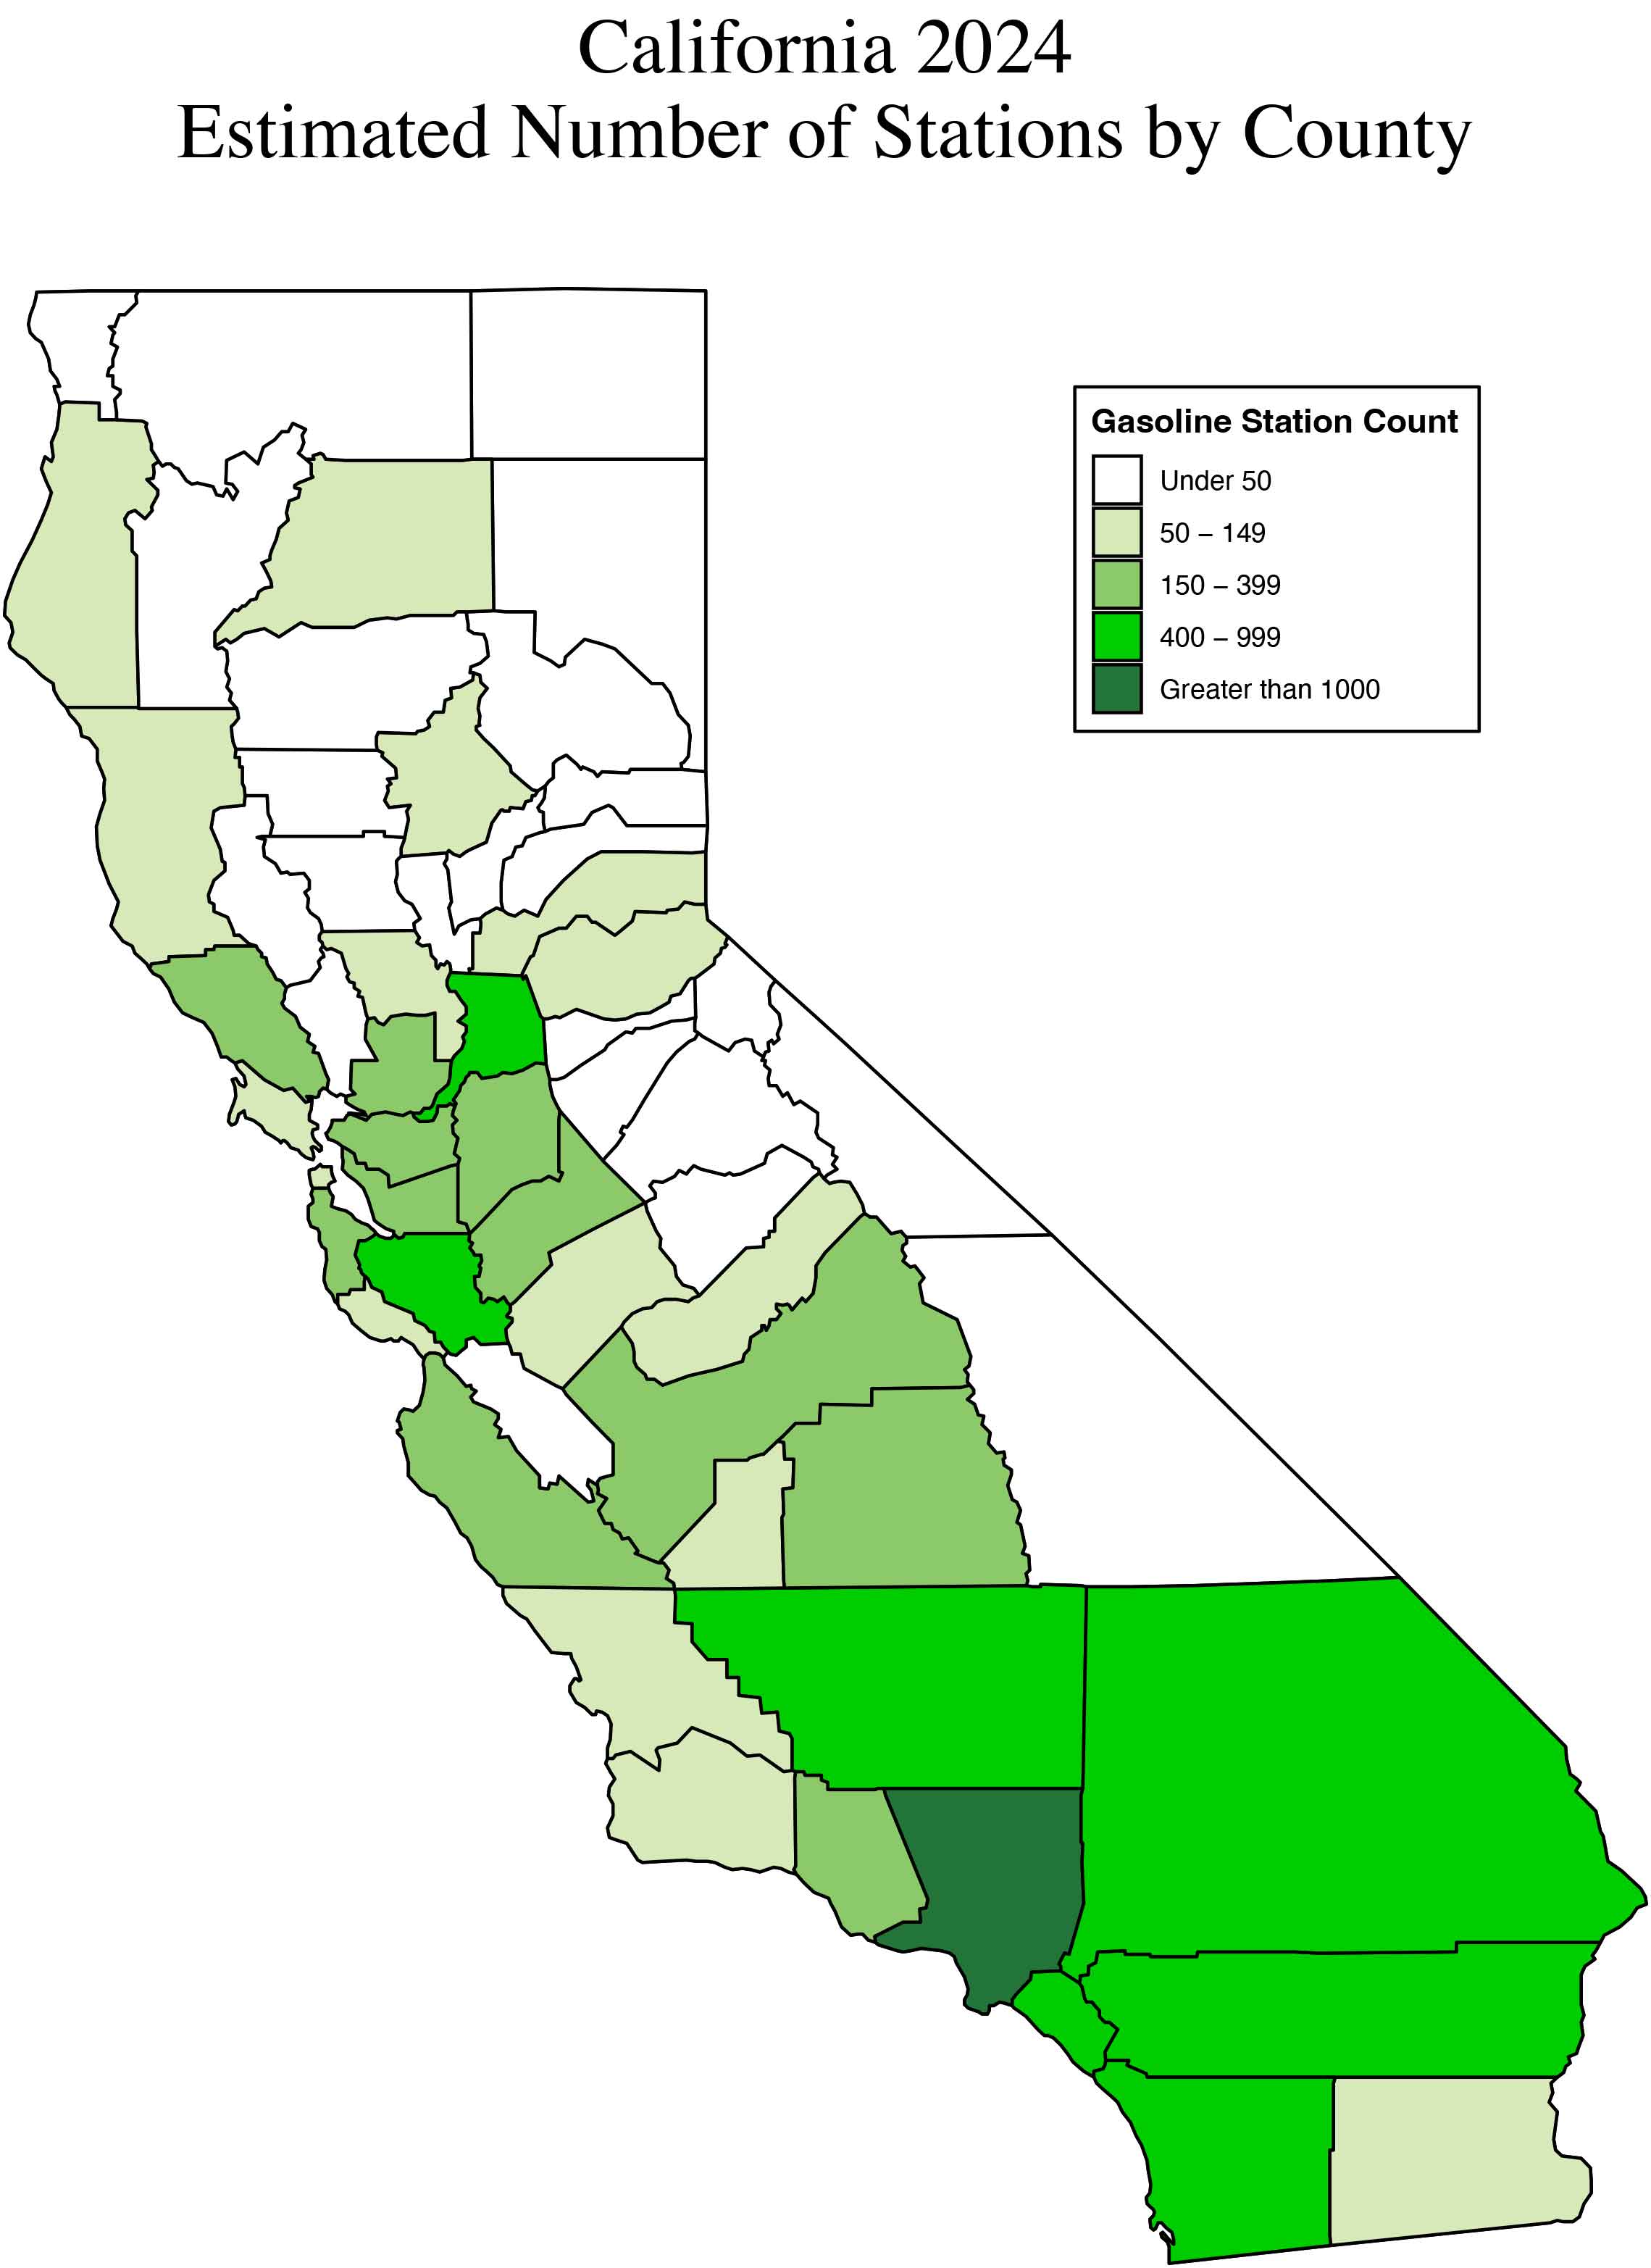
California Annual Retail Fuel Outlet Report Results (CEC-A15)
The following Excel file contains annual CEC-A15 results and analyses summarized in county level tables for station counts, gasoline sales, and diesel sales. Figures in the workbooks graphically display the gasoline sales and diesel sales tables.
A15 Survey Responses – Gasoline Sales (Million Gallons) By Municipality
The following Excel file is the total aggregated sales volume of gasoline at retail locations that completed the A15 survey by municipality and by year.
Data does not represent total consumption of gasoline in a municipality due to:
- Missing sales volumes from non-retail locations not required to respond to the A15.
- Missing sales volumes from retail locations that did not respond to the A15 survey during a particular year.
A15 Top 30 Cities - Survey Responses Gasoline Sales (Million Gallons)
| Rank | City | 2014 | 2015 | 2016 | 2017 | 2018 | 2019 | 2020 | 2021 | 2022 | 2023 | 2024 |
|---|---|---|---|---|---|---|---|---|---|---|---|---|
| 1 | LOS ANGELES | 462 | 490 | 578 | 597 | 553 | 551 | 439 | 474 | 452 | 461 | 452 |
| 2 | SAN DIEGO | 383 | 430 | 458 | 478 | 464 | 455 | 351 | 345 | 343 | 352 | 350 |
| 3 | SAN JOSE | 218 | 287 | 324 | 319 | 298 | 311 | 235 | 263 | 254 | 221 | 248 |
| 4 | SACRAMENTO | 174 | 256 | 279 | 284 | 264 | 278 | 249 | 220 | 230 | 222 | 233 |
| 5 | BAKERSFIELD | 169 | 181 | 221 | 217 | 205 | 204 | 195 | 187 | 200 | 203 | 207 |
| 6 | FRESNO | 108 | 154 | 185 | 192 | 176 | 159 | 158 | 150 | 162 | 165 | 164 |
| 7 | RIVERSIDE | 115 | 127 | 147 | 148 | 154 | 143 | 129 | 134 | 136 | 140 | 133 |
| 8 | LONG BEACH | 125 | 120 | 130 | 129 | 127 | 125 | 102 | 108 | 91 | 96 | 102 |
| 9 | CHULA VISTA | 79 | 103 | 111 | 108 | 112 | 105 | 86 | 84 | 83 | 96 | 101 |
| 10 | STOCKTON | 80 | 95 | 109 | 109 | 102 | 107 | 100 | 92 | 100 | 110 | 100 |
| 11 | CORONA | 110 | 111 | 112 | 122 | 110 | 113 | 85 | 85 | 85 | 91 | 97 |
| 12 | ANAHEIM | 96 | 115 | 136 | 135 | 129 | 121 | 92 | 97 | 94 | 97 | 93 |
| 13 | SAN BERNARDINO | 71 | 81 | 86 | 96 | 91 | 87 | 85 | 91 | 84 | 96 | 90 |
| 14 | FONTANA | 75 | 78 | 97 | 94 | 91 | 98 | 82 | 91 | 91 | 91 | 87 |
| 15 | MODESTO | 70 | 96 | 103 | 107 | 102 | 89 | 80 | 85 | 86 | 87 | 85 |
| 16 | OAKLAND | 51 | 73 | 83 | 89 | 86 | 80 | 70 | 62 | 67 | 67 | 80 |
| 17 | SAN FRANCISCO | 71 | 107 | 120 | 120 | 105 | 107 | 77 | 81 | 85 | 70 | 78 |
| 18 | ONTARIO | 76 | 70 | 110 | 98 | 92 | 84 | 75 | 71 | 75 | 67 | 74 |
| 19 | SANTA ANA | 81 | 81 | 85 | 84 | 83 | 86 | 66 | 72 | 67 | 69 | 73 |
| 20 | SANTA ROSA | 60 | 70 | 83 | 83 | 75 | 76 | 66 | 72 | 69 | 66 | 71 |
| 21 | TORRANCE | 75 | 84 | 93 | 84 | 84 | 80 | 63 | 67 | 66 | 70 | 71 |
| 22 | OXNARD | 64 | 69 | 72 | 80 | 85 | 81 | 68 | 67 | 68 | 67 | 71 |
| 23 | ESCONDIDO | 62 | 73 | 77 | 77 | 77 | 81 | 71 | 70 | 67 | 69 | 69 |
| 24 | HUNTINGTON BEACH | 66 | 63 | 74 | 73 | 70 | 67 | 60 | 60 | 60 | 61 | 68 |
| 25 | VAN NUYS | 65 | 58 | 65 | 75 | 72 | 65 | 60 | 64 | 66 | 64 | 68 |
| 26 | ROSEVILLE | 55 | 72 | 80 | 84 | 78 | 85 | 70 | 76 | 67 | 76 | 66 |
| 27 | GARDEN GROVE | 56 | 62 | 77 | 72 | 68 | 64 | 58 | 62 | 63 | 60 | 66 |
| 28 | SALINAS | 43 | 73 | 82 | 73 | 74 | 71 | 63 | 70 | 63 | 66 | 66 |
| 29 | IRVINE | 78 | 79 | 84 | 88 | 87 | 85 | 63 | 70 | 63 | 66 | 65 |
| 30 | FREMONT | 64 | 77 | 85 | 87 | 76 | 74 | 55 | 57 | 58 | 54 | 63 |
Source: California Energy Commission
Methodology for Estimating Stations and Sales
Using a statistical resampling methodology, staff estimates the total gasoline station population by matching gasoline sales reported by the California Department of Tax and Fee Administration (CDTFA). This is done by using a subset of the CEC-A15 reporting stations to estimate the characteristics of the missing fueling station population. Since large fueling retailer chains are easier to survey due to their visibility, the resampling is weighted toward smaller retailers as it is assumed they are the primary non-responders to this report.
1 According to the Air Resources Board (ARB), E-85 dispensed, in California, averages 78 percent ethanol and 22 percent gasoline depending on the month of the year and geographical location.
2 Natural Gas survey responses are measured in Gasoline Gallon Equivalent (GGE).
3 Source: California Energy Commission (CEC) analysis of California Department of Tax and Fee Administration (CDTFA) taxable gasoline figures.
4 Source: CDTFA taxable diesel figures which include taxable retail sales and taxable non-retail sales.
5 The California Energy Commission including all diesel blend, biodiesel, and renewable diesel as diesel product starting reporting year 2022.