This visualization tool interactively displays BUILD projects and serves as a data portal for applicants, interested stakeholders, BUILD staff and the public. The viewer can access BUILD project data including funding amounts, project size, climate zone, estimated GHG emissions avoided and more. The tool provides several data visualization graphs and tables, as well as indicators which highlight BUILD information.
BUILD GIS Tool
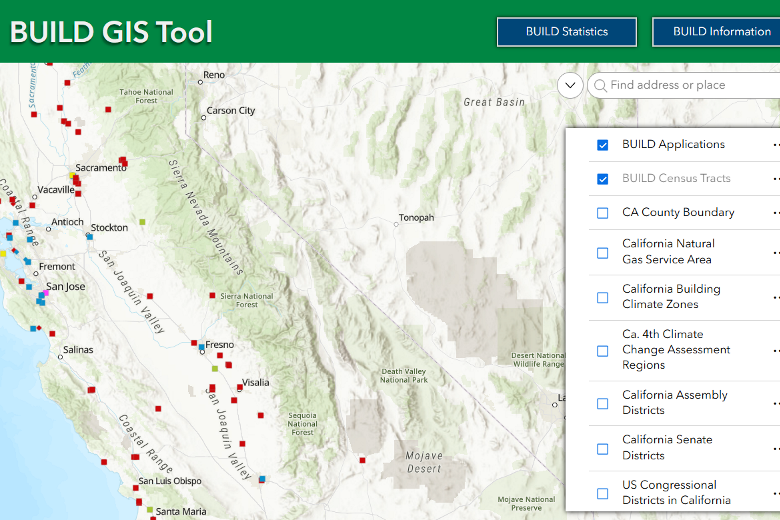
The GIS Tool can be viewed using a PC, tablet, or mobile devices with a minimum desktop window size of 1440 x 900 or mobile desktop window size of 1200 x 800. If you have trouble viewing the map content, the BUILD Project Data is available for download.
- Use the clickable tab to the left to expand and display the BUILD Project Filter, and search currently existing BUILD project data.
- Users can select different graphs by using either the directional arrow symbols (◄ ►) near the graph title to cycle through different graphs, or click the title of the graph to display a drop-down list to choose from such as:
- Estimated Funding Allocation by IOU territory
- Cumulative Incentive Reservation Amounts by Climate Zone
- Cumulative Incentive Reservation Amounts by Region
- Potential Avoided GHG Emission by Climate Zone
- Application Status by Region
- BUILD Program Low-Income Eligibility Type
- Approved Number of Units by Region
- Cumulative number of Units/Bedrooms by Region
- By default, the table lists all project data submitted to the BUILD program until filtered using the BUILD Project Filter (see Step 1).
- Potential applicants can input an address into the search box in the top-left corner to locate census tract data. Click once on the map afterward, to generate a pop-up window to display various metrics including:
- Low Income Eligibility indicators (either Low Income Community designation or Disadvantages Community designation)
- Gas Provider
- Climate Zone
- A table below the map can be displayed/hidden by clicking the arrow icon (▲) to open the attribute table which contains all BUILD Project data from the Table on the left.
- The attribute table in the top-left corner under Options is able to filter, show/hide columns, and export BUILD project data to an excel file (.csv).
References
BUILD Geographic Information System (GIS) Tool User Guide - Detailed user instructions on each function of the GIS Tool, including visual aid and additional instructions not covered in the “How to use the Tool” section.
Information
Symbol colors indicate the building type. BUILD Projects can be classified in four different building types: Single family (dark blue), Multifamily low-rise (dark green), Multifamily mid-rise (yellow), Multifamily high-rise (light purple) and Mixed-use (red). By exploring the GIS Tool a viewer can access project-specific information including property names, location, low-income designation, incentive amount, estimated GHG emissions avoided, relevant utilities providers, application status, building type and size.
Data Last Updated: May 25, 2023
Data Collection Information
The BUILD GIS Tool data is collected and maintained internally by BUILD staff based on the applications received. This dataset includes all applications received and provides the status and statistics of each application. The data is updated frequently as new applications are submitted.
For further information, contact BUILD@energy.ca.gov
Citing
Please cite use of these data and images. California Energy Commission [Year]. California Energy Commission [Map Title] Data last updated [insert date last updated]. Retrieved [insert date retrieved] from [Map URL].